On the road to achieving digital transformation, system integration as a core step would not be complete without supporting and maintaining the integrations and the entire IT infrastructure. Understanding and anticipating the pitfalls, along with proper error handling and predictability of the problems is crucial. Integration support and monitoring should meet business performance, operational expectations, and business security needs and this is the focus of our Monitoring Solutions.

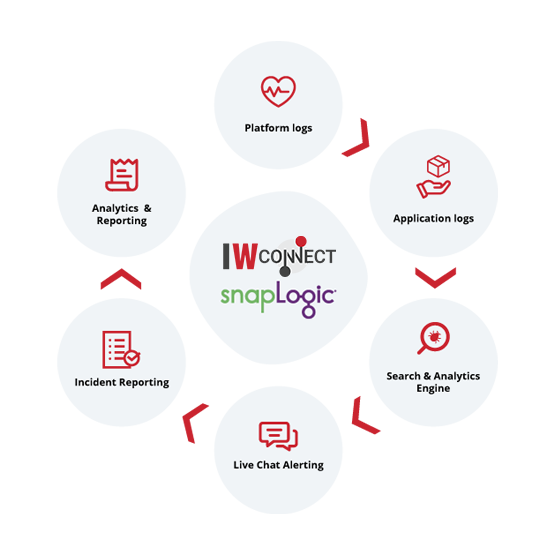
⋮IW Monitoring Solutions gathers data from different sources of an enterprise, analyzes the gathered data from different aspects, and provides enterprises one source of truth. This enables companies to overcome the silo-approach that slows down business flows and collaboration within teams and among different departments.

Simple, yet robust analysis solutions for both developers and DevOps engineers, as well as Business owners, our Monitoring Solutions enable users to gain valuable insights on failure diagnosis, application performance, and infrastructure monitoring.

The idea behind Monitoring Solutions is to fulfill the need in the log analytics space by exploiting the potential of enterprise data and generating updated insights in real-time. With the whole bundle, organizations obtain great benefits in terms of resources used and results achieved.

Core Benefits

  • Reduce costs and save time by resolving problems faster
  • Increase operational efficiency
  • Improve customer experience
  • Improve team communication and collaboration
  • Reduce manual work completely by automating the entire process of integrations monitoring
  • Improve application performance
  • Eliminate the chances for application downtime
  • Achieve strategic business objectives and performance targets
  • Gain detailed insights into past and present problems and possible incidents
  • Plan and adjust business strategies based on data gained from solid analysis

What it Does

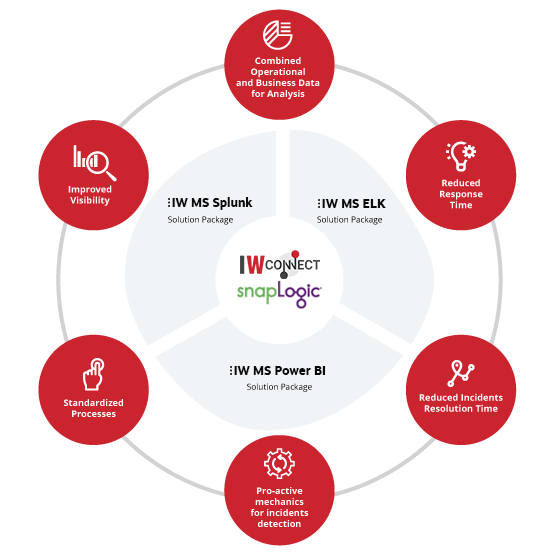
Monitoring Solutions monitor SnapLogic platform performance near real-time, detect peak loads and failures, proactively monitor hardware and alerts for limitations, send preventive alerts, and automatically log incidents in an incident management system.

The packages come with 4 types of dashboards that provide detailed incident information and are tailored specifically for every team within your organization.

Types of Dashboards and Their Features

Snaplex Dashboard
  • Monitors Snaplex and Snaplex Node CPU Usage to achieve optimal platform performance
  • Monitors Snaplex Memory Usage as a key indicator to potential problems
  • Current Disk Usage panel
  • Open File Descriptors count with visual representation of the most critical numbers
  • Current active threads
Developers Dashboard
  • Pipelines processing status timechart
  • Pipelines status table with historical data
  • Most Used Pipelines within a configurable timeframe
  • Average execution time per pipeline based on historical data
  • Latest execution status count based on distinct pipelines from the last batch
  • Latest pipeline execution recorded state for all pipelines
  • List of all failed pipelines within a configurable timeframe
  • Custom URLs to Stack Trace and Pipeline Designer that reported the error
  • Custom correlation between Parent and Child pipelines
Operational & Business Insights
  • Real-time incidents reporting
  • De-duplication mechanisms for duplicate tickets reduction
  • Fully customizable incidents reporting: priority, assignee, description or any other field
  • Reactive and Pro-active reporting rules for increased operational predictability
  • Live chat alerting through Slack & MSTeams
  • Customizable e-mail reporting – scheduled and on-demand, for increased transparency and visibility within the organization
Business Dashboard
  • Pie chart of the pipelines count per status
  • Count of delivered records
  • Count of error records
  • Execution per host
  • Executions per pipeline
  • Line chart with executions per Project
  • Most common errors for the selected period

Packages

Solution ComponentsMS SplunkMS ELKMS Power BI
SnapLogic Logging and Exception Handling FrameworkT&MT&MT&M
SnapLogic Platform Snaplex/Pipelines logging
Customized Dashboards
Live chat alerting – Slack✓*
Live chat alerting – MS Teams✓*
Automated incident reporting – Atlassian Jira✓*
Automated incident reporting – ServiceNow✓*
Automated incident reporting – Azure DevOps✓*
* Limitations apply based on licensing of PowerBI and the alerting limitations based on thresholds instead of log data