


AI-Powered Observability &
Autonomous Operations

Move beyond dashboards. Transform your DevOps and Managed Services into intent-based operations powered by agentic workflows, automated diagnostics, and self-healing systems.

The Industry Shift: From Monitoring to Intent

Infrastructure as Code (IaC) is no longer a differentiator, it is the baseline. The real advantage today lies in orchestrating, validating, and operationalizing systems through AI-supported agentic workflows.

“We are moving toward Platform Engineering where AI agents interpret intent, validate configurations, and enforce policies in a controlled, auditable manner.”

Traditional Monitoring

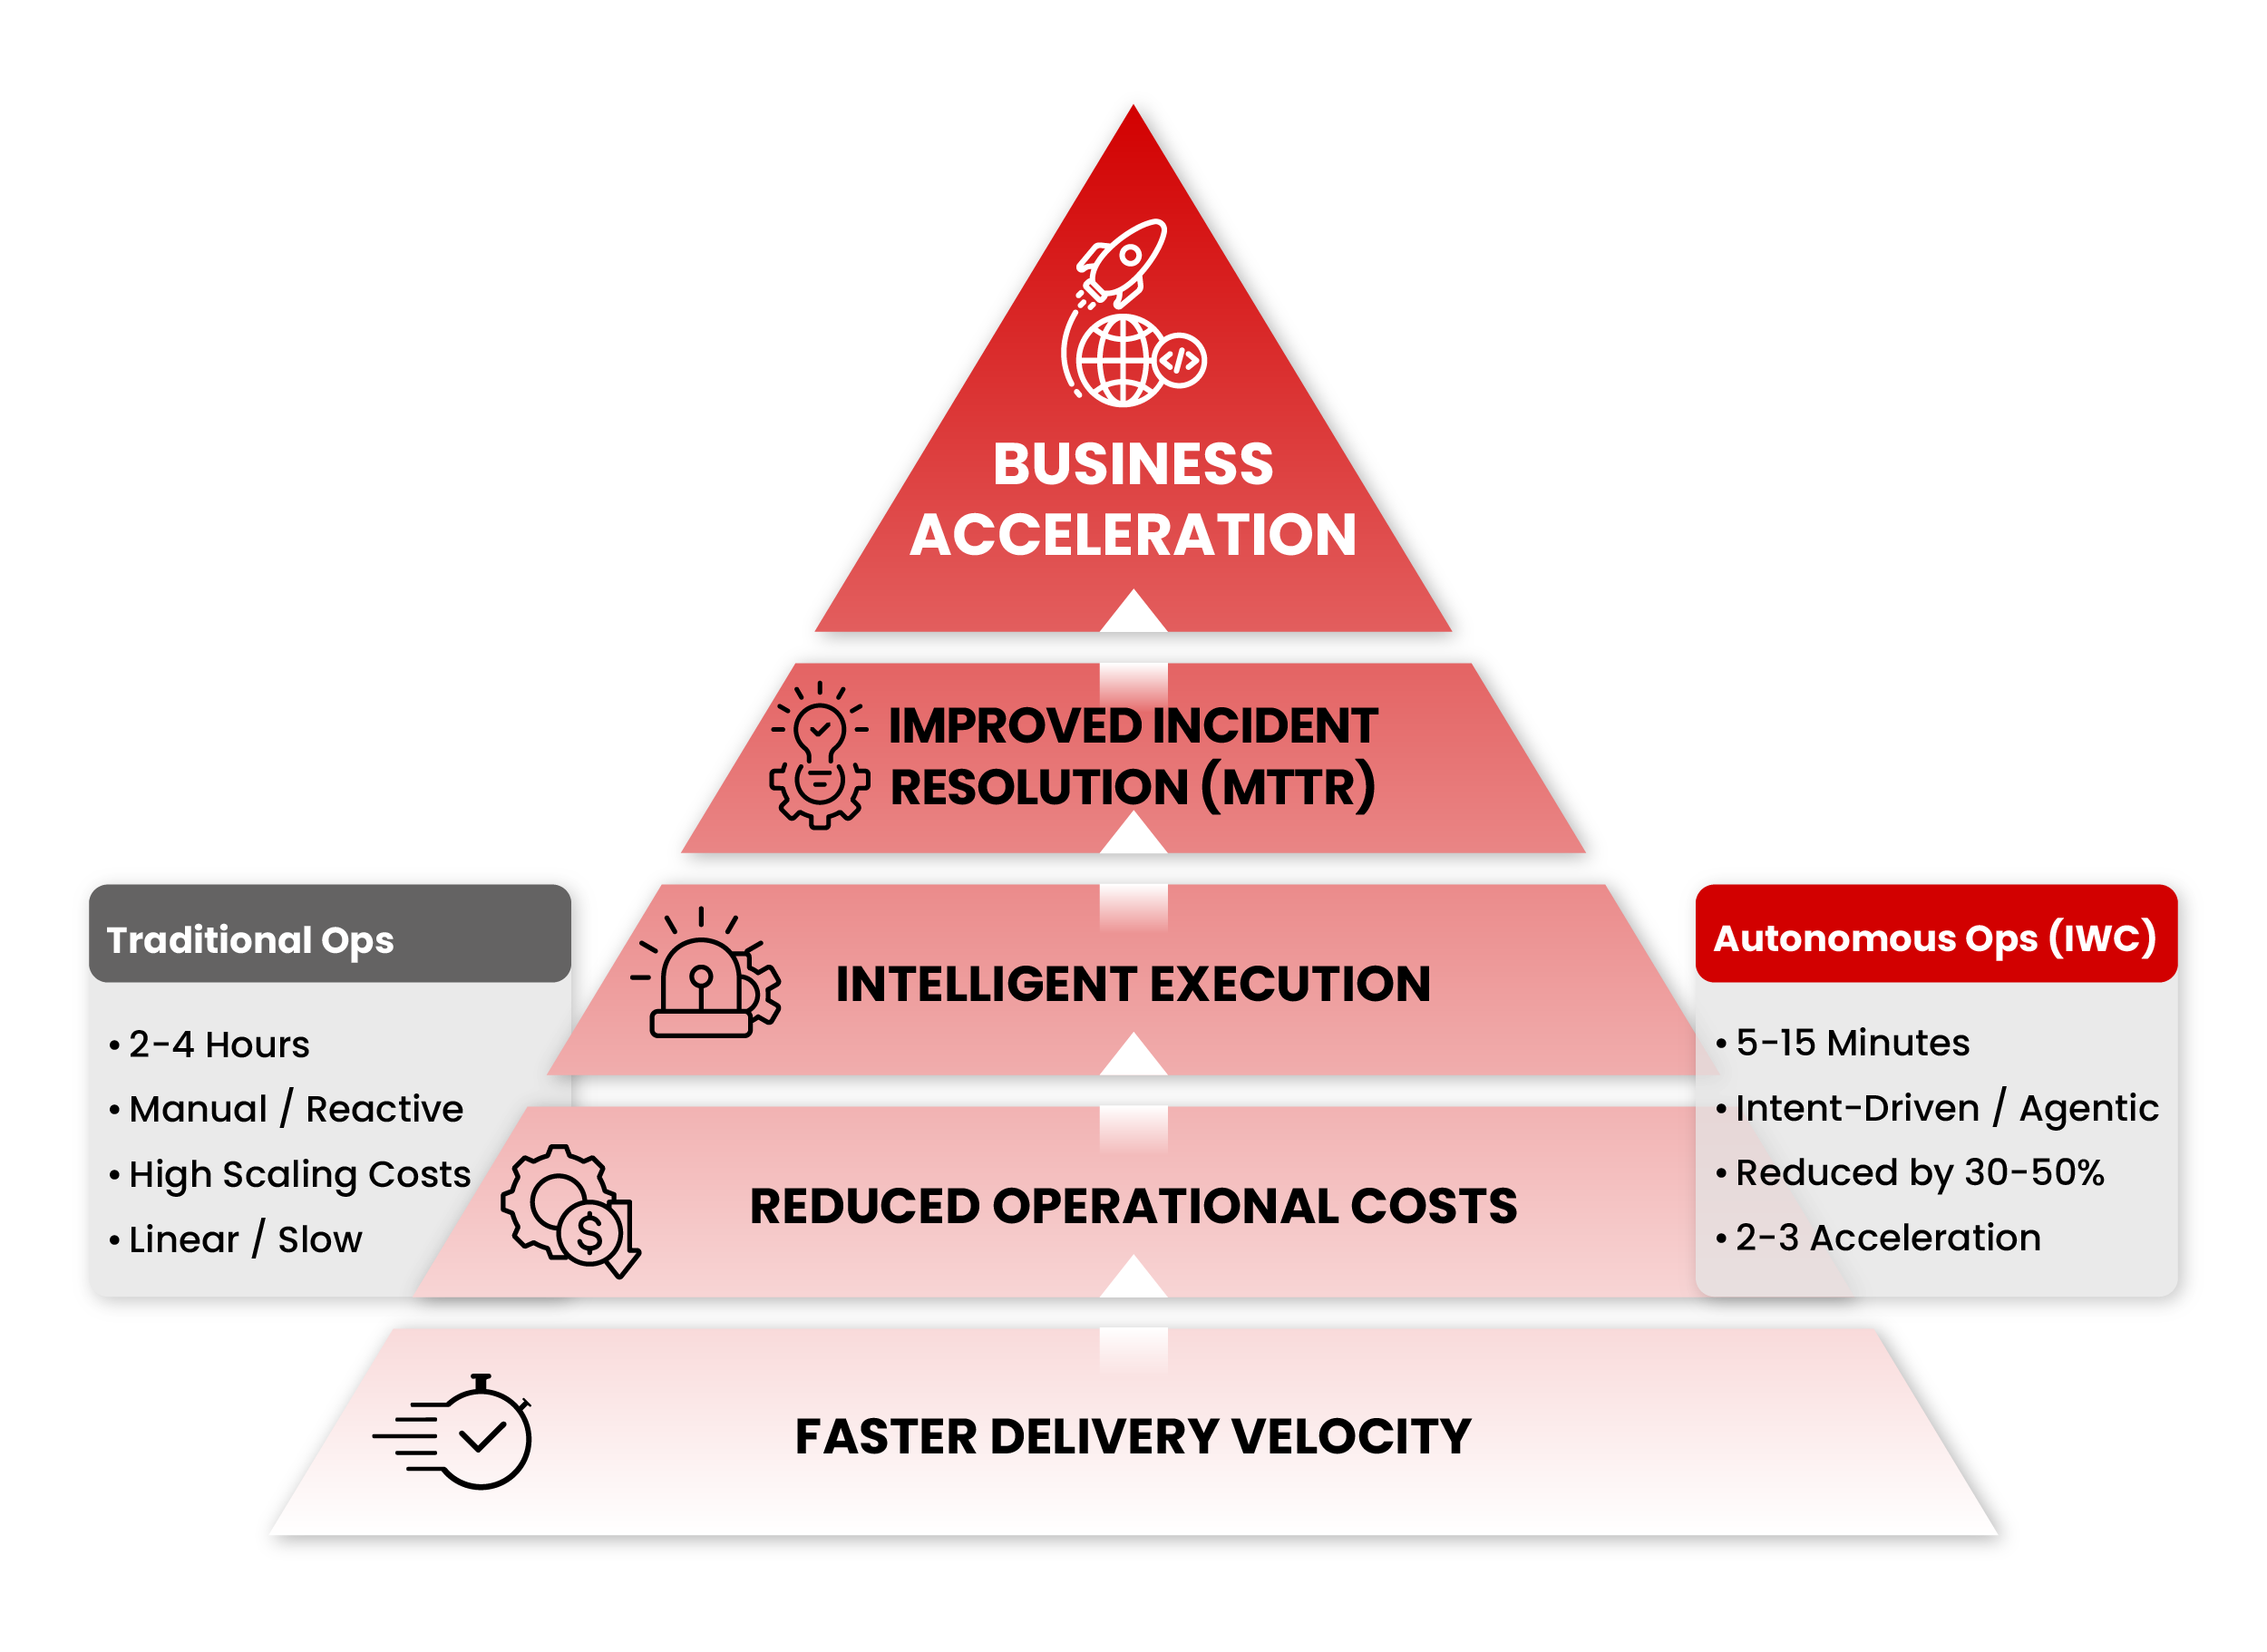
Manual incident investigation and reactive delivery models make businesses non-competitive.

The Agentic Future

AI agents (using MCP) interact directly with cloud environments to resolve issues in seconds.

Architecture Overview

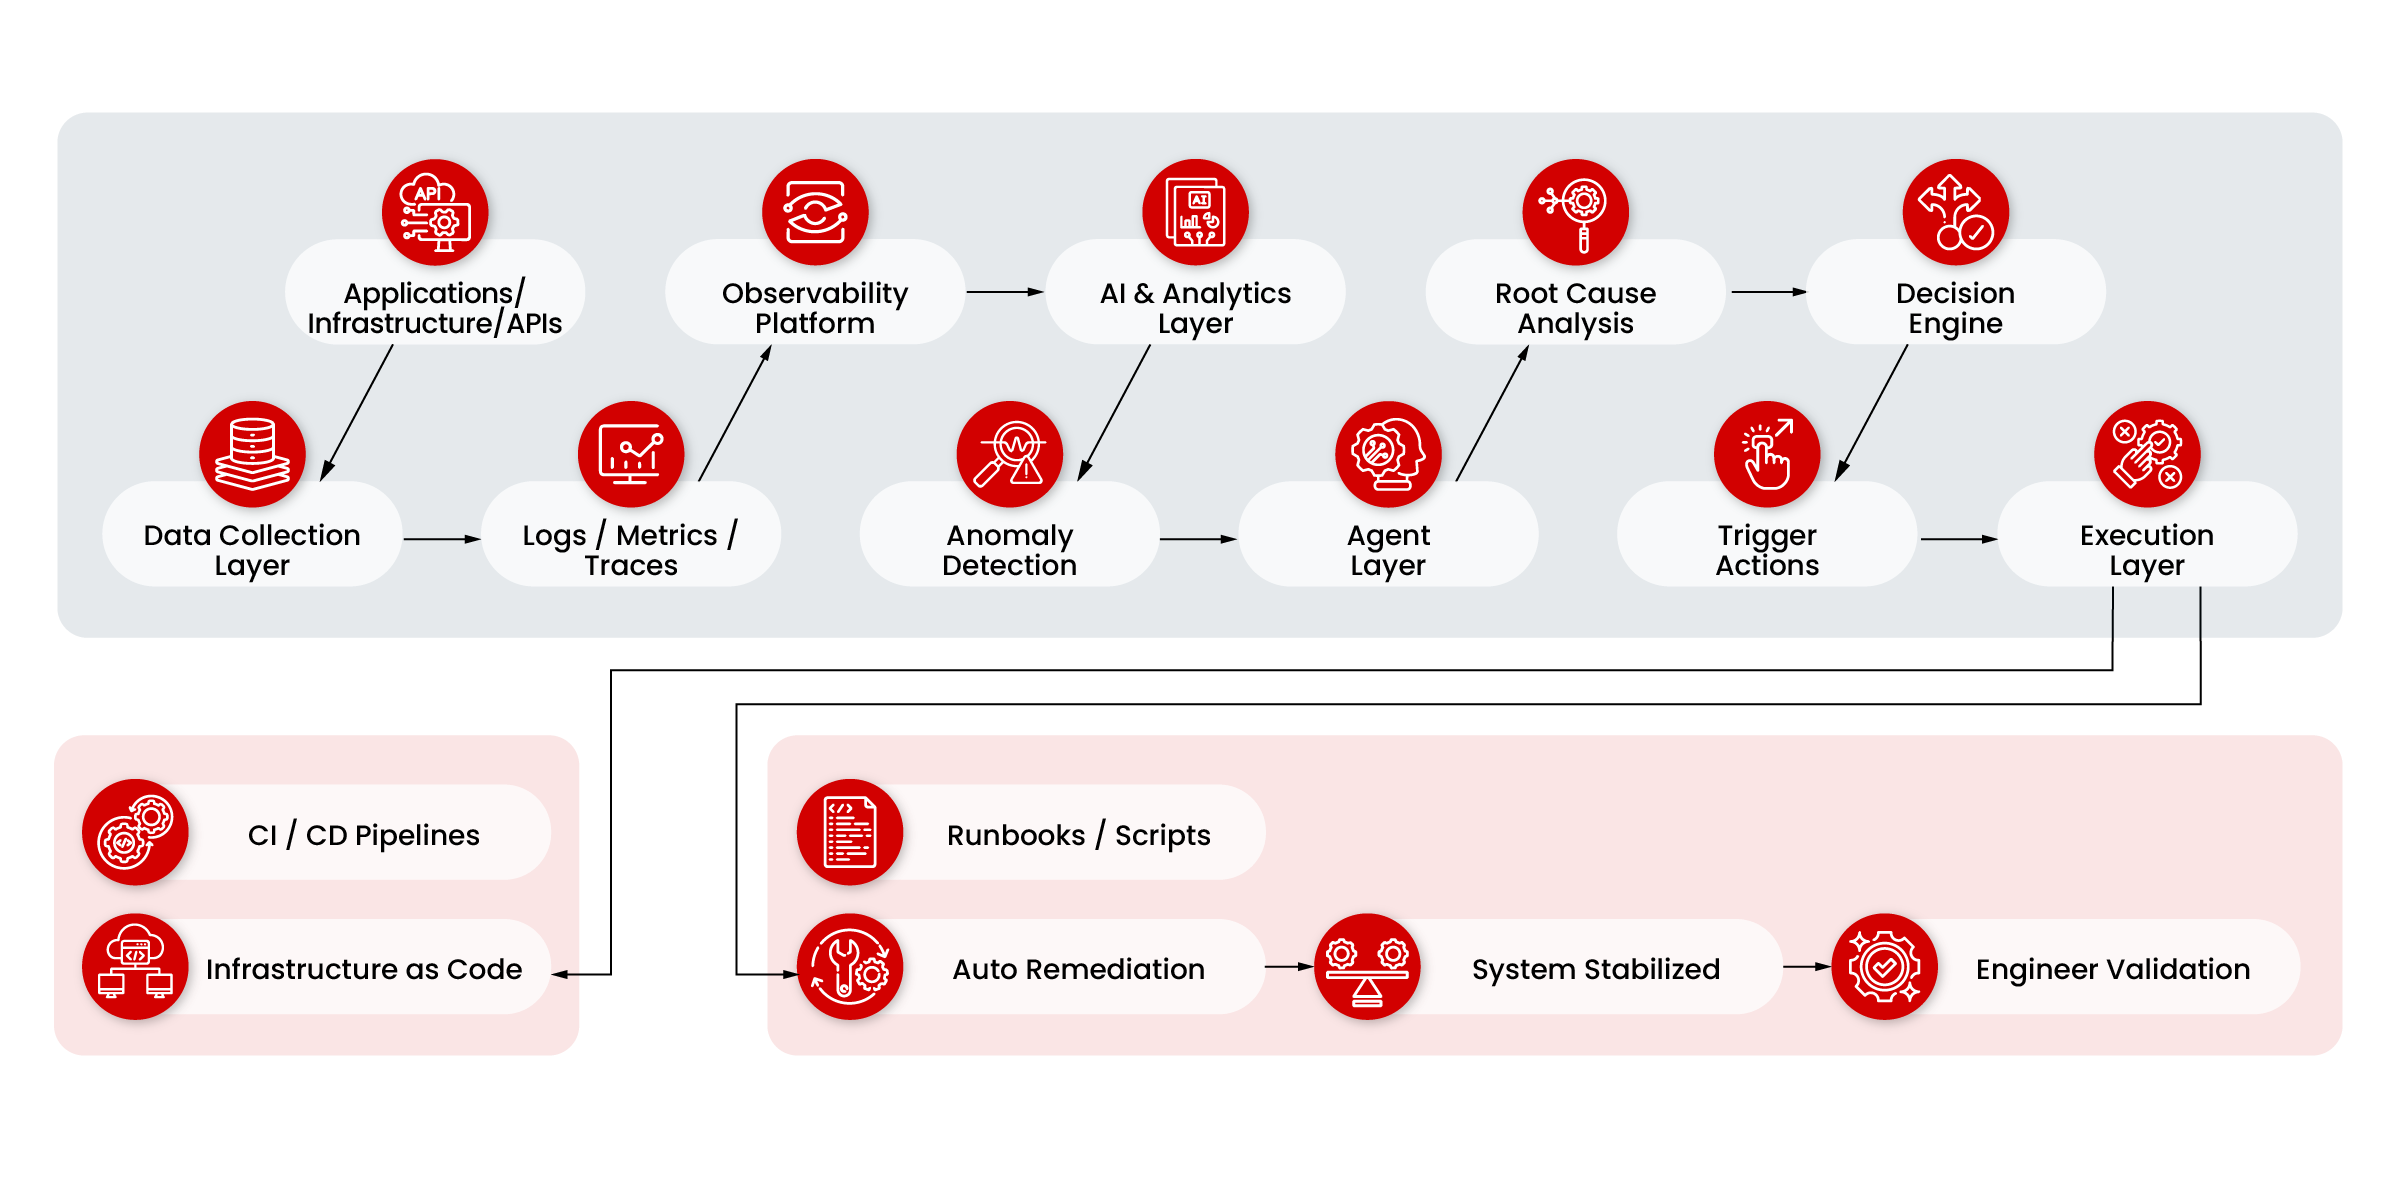
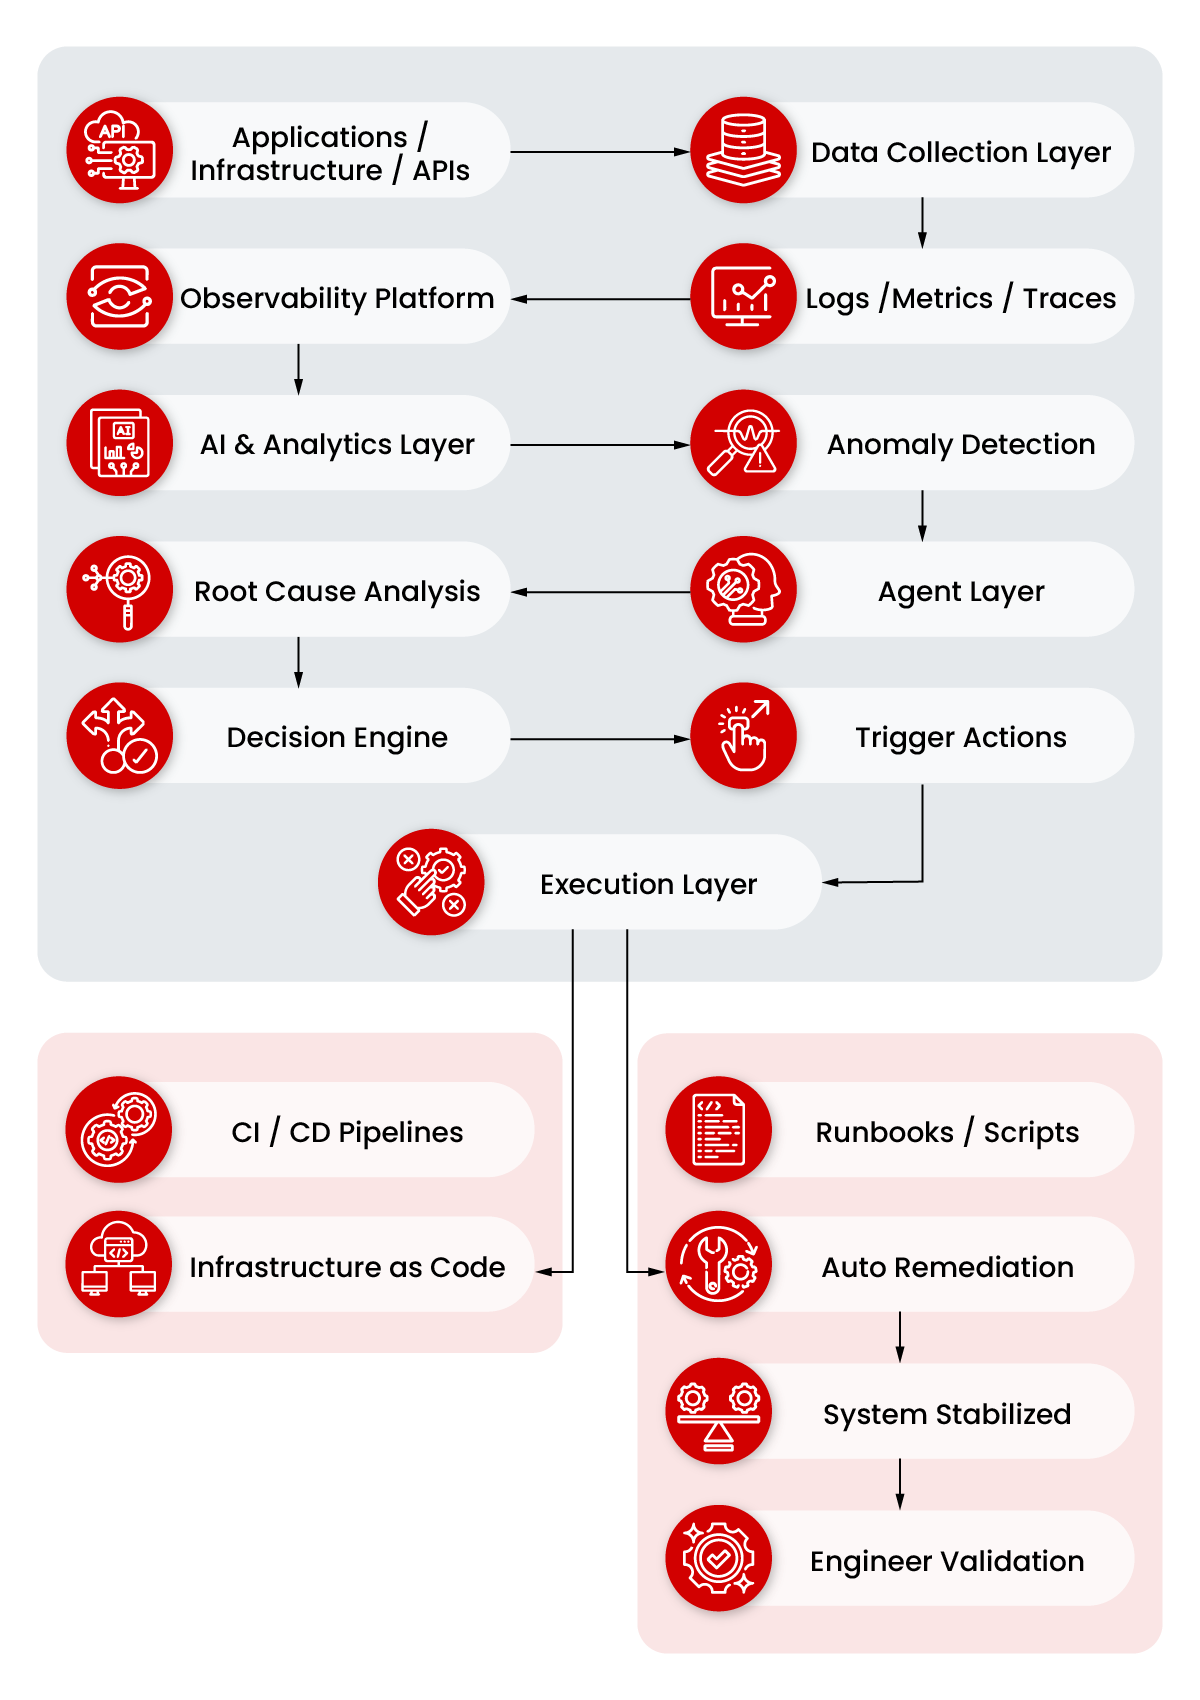
Our Unified Model for Autonomous Operations

Observability

Full-stack visibility using OpenTelemetry, Logs, Metrics, and Traces to feed the AI context.

Agent Layer

LLM-based agents (GPT-5 class) that don’t just “chat” but execute operational tasks via MCP servers.

Execution

Automated CI/CD triggers, self-healing runbooks, and infrastructure-as-code validation.

High-Impact AI Agent Use Cases

How our AI agents move from passive chat bots to active operational partners in your environment.

Smart Scaffolder

Automated provisioning by connecting AI directly to Git repositories. Turns hours of boilerplate configuration into a 30-second task.

Cloud Auditor

Automated security checks using local CLI credentials via MCP. Instant detection of open S3 buckets or permissive NSGs.

FinOps Forecaster

Connects codebases to Cloud Pricing APIs for instant, accurate cost estimation of infrastructure before it is deployed.

Handoff Documenter

Combines filesystem MCP and Confluence APIs to write 90% of technical “How-To” documentation automatically from the source code.

Cloud Translator

Automated translation of legacy on-prem or cross-cloud stacks (e.g., AWS to Azure) into modern Terraform blocks.

Least Privilege IAM

AI analyzes function code to generate the exact, strict IAM/RBAC policies required, eliminating security over-provisioning.

Implementing AI observability?

1

Baseline Definition

Establish performance and quality benchmarks

2

Instrumentation

Add monitoring hooks to all AI systems

3

Dashboard Setup

Build operational visibility and alert thresholds

4

Runbook Creation

Define response procedures for every incident type

5

Data Quality & Observability Operationalization

Trust becomes measurable

6

AI Enablement & Controlled Rollout

From reliable data to safe AI

Our Success Stories

Consultant reviewing IT monitoring reports and dashboards

How We Cut IT Monitoring Costs by $100K Without Compromising System Reliability

A US-based fintech enterprise running critical B2B payment platforms faced rapidly escalating Datadog costs and declining monitoring effectiveness after multiple engineering teams independently adopted observability tools without central governance.

Abstract red neural network visualization representing AI-enhanced exception handling

37% Faster Resolution: ResQAI Brings AI Enhanced Exception Handling to Enterprise Retail

One of Europe's largest retailers faced fragmented exception handling that drained engineering resources and slowed incident response. ResQAI helped improve resolution speed by bringing AI-enhanced exception handling into enterprise retail operations.

Operations lead standing between blue monitoring dashboards

From Guessing to Knowing: How to Predict System Failures Before They Happen

Modern digital systems generate large volumes of operational data, but many companies still react to incidents after they happen. This case study shows how predictive monitoring can help teams move from firefighting to earlier failure detection.

Retail data operations performance dashboard with KPI charts

Enhancing Retail Data Operations with Azure Monitoring and Alerting

A Scandinavian retail company relied on SnapLogic for data processing but had limited monitoring based on basic email alerts. Azure monitoring and alerting helped improve real-time visibility and operational control.

Technology stack for AI Monitoring & Observability

Observability & AI Intelligence

AI-driven monitoring, real-time anomaly detection, predictive analytics, and intelligent root-cause analysis across multi-cloud environments.

  • Datadog
  • Splunk
  • Grafana
  • OpenTelemetry
  • LLM-based Analysis

Cloud Platforms & Infrastructure

Multi-cloud and hybrid cloud management with infrastructure-as-code and AI-optimized provisioning and scaling.

  • Azure
  • AWS
  • GCP
  • Kubernetes
  • Terraform
  • Bicep

AI & Vector Intelligence

Semantic search, knowledge retrieval, and intelligent data processing using large language models and vector databases.

  • Azure OpenAI
  • OpenAI
  • Vector Databases
  • LLM-based Analysis

Automation & AI-Augmented DevOps / MLOps

Intelligent CI/CD pipelines, automated infrastructure deployment, and AI agents that optimize DevOps and MLOps workflows.

  • GitHub Actions
  • Azure DevOps
  • CI/CD Pipelines
  • Custom AI Agents

AI-Powered Cybersecurity & Resilience

Proactive threat detection, automated security responses, zero-trust enforcement, and AI-driven risk management.

  • Zero-Trust Frameworks
  • Automated Defense
  • Intelligent Guardrails

Managed Services & AI-Enhanced ITSM

AI-powered incident management, predictive maintenance, automated remediation, and intelligent IT service workflows.

  • AI Agents for ITSM
  • Predictive Insights
  • Automated Resolution
  • AIOps

Anomaly Detection & Predictive Operations

AI-assisted detection of unusual system behavior, early warning signals, operational risks, and patterns that may lead to incidents.
  • AI Anomaly Detection
  • Predictive Monitoring
  • Operational Risk Signals
Abstract visualization of an AI processor connected to a monitoring network

Monitoring With Measurable ROI
Turn System Visibility Into Business Value

Observability impact

0 %

Reduction in Mean Time to Detect (MTTD)

0 %

Cost savings through usage optimization
0 min

Issue identification (down from 4 hours)

What's your AI actually doing in production?

Observability assessment. We’ll identify monitoring gaps and quick wins.

FAQ

AI Monitoring & Observability questions, answered.

Practical answers about AIOps, autonomous operations, AI-powered incident response, observability platforms, self-healing runbooks, and operational intelligence.

What is AI monitoring and observability?

AI monitoring and observability use telemetry, logs, traces, metrics, events, and AI-assisted analysis to understand system behavior, detect anomalies, identify root causes, and support faster operational decisions across applications, cloud infrastructure, data pipelines, and AI systems.

How is AI observability different from traditional monitoring?

Traditional monitoring usually tells teams when something is wrong. AI observability helps explain why it is happening, what systems are affected, what actions should be taken, and which runbooks or workflows can help resolve the issue faster.

What are autonomous operations?

Autonomous operations use AI agents, automation workflows, runbooks, and controlled execution paths to detect issues, analyze context, recommend actions, and perform approved operational tasks with human oversight where needed.

How do AI agents help with incident response?

AI agents can analyze alerts, correlate telemetry, summarize incident context, identify likely root causes, recommend remediation steps, trigger approved runbooks, and prepare handoff documentation for engineering, DevOps, SRE, or managed services teams.

What systems can IWConnect monitor?

IWConnect can support monitoring and observability across cloud platforms, Kubernetes, applications, APIs, integrations, CI/CD pipelines, infrastructure, data workflows, AI systems, ITSM processes, and managed service operations.

How do self-healing runbooks work?

Self-healing runbooks define approved remediation actions for known incidents or operational patterns. When an issue is detected, the system can recommend or trigger controlled actions such as restarting services, scaling resources, opening tickets, notifying teams, or rolling back a change.

How do you measure ROI from AI observability?

ROI can be measured through reduced mean time to detect, reduced mean time to resolve, fewer false alerts, lower monitoring costs, improved uptime, faster incident triage, better resource utilization, and more efficient handoffs between support, DevOps, SRE, and engineering teams.

How do we start with an observability assessment?

The first step is to define the current observability baseline, including systems, telemetry sources, tools, dashboards, alerting rules, runbooks, incidents, operational pain points, and business priorities. From there, IWConnect identifies where AI-assisted observability and automation can create the fastest operational value.