©IWConnect. All Rights Reserved.
Enterprise Data AI — Semantic Layer
PrismAI – engineering intelligence
DevOps tells you how you’re performing technically.
PrismAI tells you where you are losing money — and shows you the optimal way to deal with it.
PrismAI is not another technical report — it’s a flashlight focused on hidden risks and “smoke”.
PrismAI builds intelligence from your DevOps data — see where you’ll have burnout or knowledge silos.
PrismAI shows “what actually happens” — convert RCAs to facts vs intuition.
Most engineering tools stop at the commit. PrismAI goes further – analyzing the signals that predict burnout, attrition, and knowledge concentration before they become your next crisis.
PrismAI analyzes signals of burnout and identifies “Knowledge Silos” where critical systems depend on a single person. Identify risk before it turns into attrition or system outages. The bus factor isn’t just a technical metric — it’s a business continuity risk that Prism surfaces continuously, not after the resignation letter arrives.
PrismAI converts engineering incidents into euros. Duration × hourly rate × engineers involved, per incident, per file, per quarter. €536 average cost per incident. €6,428 in one period. Your board can now see the real cost of technical debt.
The "Cost by Root Cause File" chart tells you which two files are responsible for the majority of your incident spend. So you fix the right thing, not the loudest thing.
Pipeline Health shows you CI/CD stage analytics, pass rates, and flaky test tracking, broken down by Build, Unit Tests, Integration, E2E, Security, and Deploy. 83% of total pipeline time is in tests. The Integration stage is your flakiest at 30%.
These aren't vanity metrics. Each flaky run is a developer context switch, a delayed deployment, and a confidence loss in your CI pipeline. Prism names the problem, quantifies the cost, and points to the fix.
PrismAI connects GitHub or GitLab, PagerDuty or OpsGenie, and Jira — and calculates what those tools individually can’t show. Every calculation is transparent and auditable.
A risk score per file combining change frequency, incident count, and author concentration. The file your team keeps patching — named and ranked.
Every incident converted to euros — engineer hours × hourly rate × resolution time, per file. CFO-ready numbers, not gut feel estimates.
PrismAI metrics calculated automatically and benchmarked against Elite / High / Medium / Low industry tiers — always current, never assembled manually the week before a review.
Single-author files flagged proactively — before a resignation turns bus factor into a crisis. Continuous analysis, not a post-departure emergency.
After-hours deploys, weekend commit heatmaps, and on-call concentration identify teams operating unsustainably — before it becomes burnout or an outage.
Monthly engineering health digest. Quarterly C-suite report with AI narrative and one top action. Leadership gets answers — not dashboards.
These are the questions your leadership asks before every quarterly review — and the honest answers most engineering teams give today.
| Question from leadership | Today | With Prism |
|---|---|---|
| Is our team getting faster or slower? | Prism metrics assembled manually the week before the review. Usually presented with "we think." | Automated PrismAI trend, always current — Elite / High / Medium / Low against the State of DevOps benchmark. |
| Which code causes most of our outages? | Unknown. Post-mortems name symptoms. The actual files are never identified. | File risk score combining commit history and incident count. Top 2–5 files named, ranked, and reported monthly. |
| What did our incidents cost last quarter? | Engineer time is never converted to money. The cost stays invisible until it repeats. | Incident cost = duration × hourly rate × severity. Calculated per incident, per file, per quarter. CFO-ready. |
| What happens if our lead engineer leaves? | Nobody knows until it happens. Emergency knowledge transfer starts under pressure. | Continuous bus factor analysis. Single-author files flagged before any resignation forces the issue. |
| Are we getting value from our tooling spend? | €60–80 per developer per month across multiple SaaS tools. Calculations are opaque. | Self-hosted. No per-seat fee. All metrics in one deployment with fully transparent, auditable calculations. |
Scroll to compare
Three phases. Clear milestones. No surprises — and zero work for your team. We install it, connect your tools, and send the reports.
We map your toolchain and document the questions your leadership needs answered.
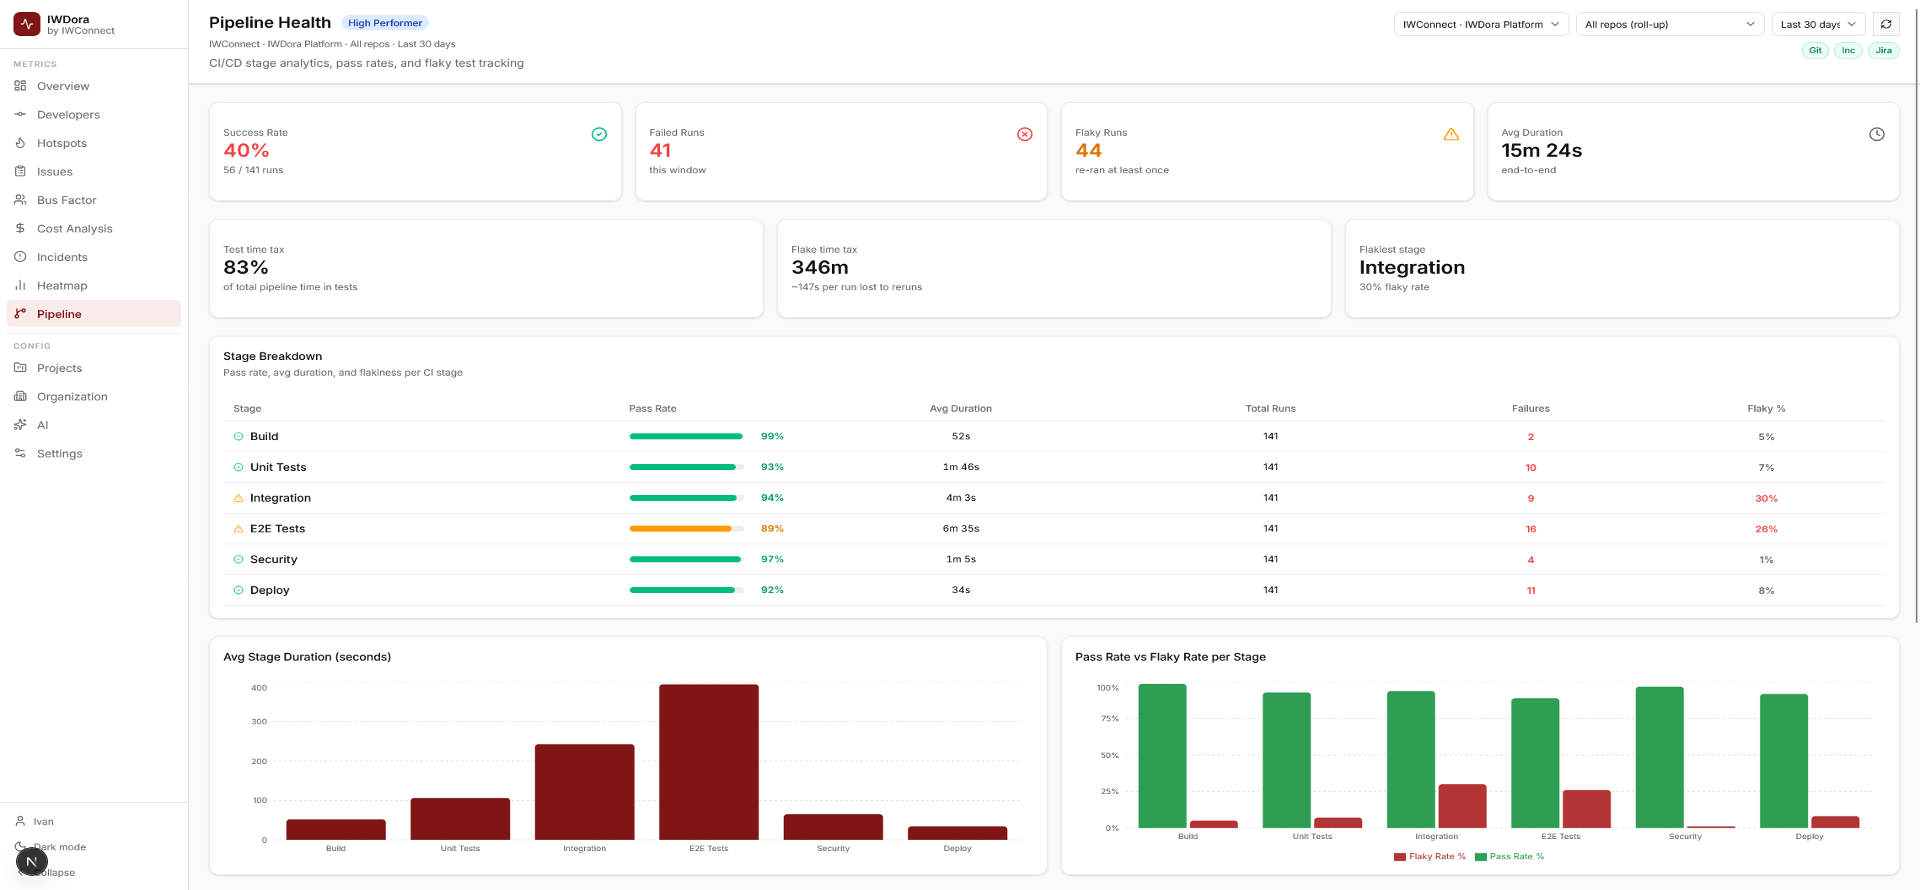
We deploy PrismAI, connect your tools, and deliver your first engineering health report — fast.
Leadership gets a quarterly PrismAI benchmark and an AI-generated board digest — no translation needed.
No lock-in. Take the license and run it independently, or let us manage it. The data and calculations are always yours. Self-hosted — nothing sent to a vendor's cloud.
A prism doesn't change what passes through it — it reveals what was always there. White light enters, and the full spectrum emerges. Your DevOps data already contains the truth about your team's velocity, cost, burnout signals, and hidden risks. Prism breaks it apart into the components you can actually see and act on. The answers were always in your pipeline. Prism just makes them visible.
We’ll run a live example – top risk files, incident cost, PrismAI tier, bus factor. No commitment. No setup on your side.
©IWConnect. All Rights Reserved.