Why Do We Need a Special System for LLM Applications?
Imagine you’ve just built your first AI chatbot. You test it yourself, and it works great. The answers look smart, the tone feels natural, and you’re excited to let others try it.
Then the first customer comes back with feedback:
- “It was slow when I asked a longer question.”
- “Sometimes it gave me the right answer, other times it made something up.”
- “How much does each conversation cost us?”
Now you open your application logs. You see the usual technical data: request IDs, timestamps, maybe a stack trace. But none of that tells you why the model gave a weird answer, where the delay came from, or how many tokens (and dollars) were burned on that request.
This is the challenge with LLM-powered apps:
- They are non-deterministic (the same input can produce different outputs).
- They often involve multi-step chains (retrieval, reasoning, generation, validation).
- They are expensive (every token counts).
- And clients care about quality metrics like accuracy, hallucinations, and user satisfaction – things normal logs don’t capture.
That’s why a new category has emerged: LLM Observability.
It’s not just about “is the service up?” but about tracing prompts and responses, measuring costs and latency, collecting feedback, and running experiments to continuously improve.
This is exactly where Langfuse comes in – an open-source observability and analytics platform built specifically for LLM applications.
What is Langfuse?
Langfuse is an open-source observability and analytics platform for LLM applications. It helps developers trace prompts and responses, monitor costs and latency, collect user feedback, and run evaluations-making it easier to debug, optimize, and scale AI apps in production.
Why Langfuse?
The rise of large language models (LLMs) has unlocked powerful new applications-from AI copilots to autonomous agents. But shipping these systems into production isn’t just about calling an API. You need visibility, control, and iteration speed. That’s where Langfuse comes in.
Key Benefits of Langfuse
– Deep Observability
Langfuse lets you capture every step of an LLM interaction-prompts, responses, latencies, errors, embeddings, and costs. Instead of guessing why your app behaves a certain way, you get full visibility into prompt chains and agent reasoning.
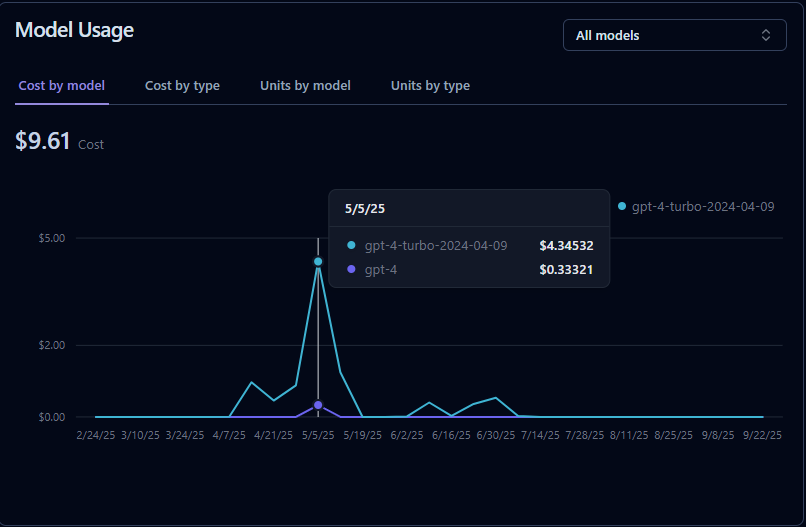
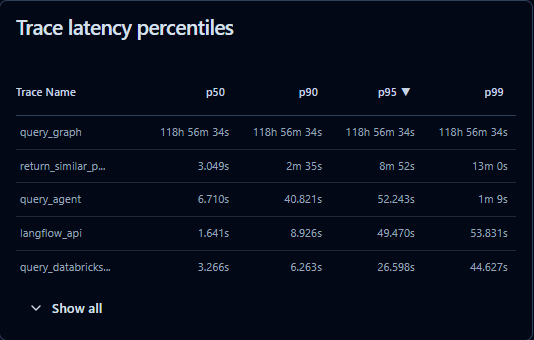
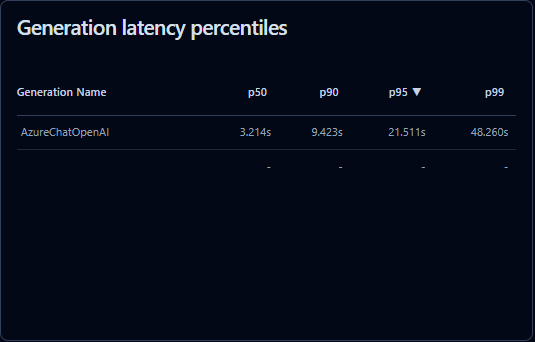
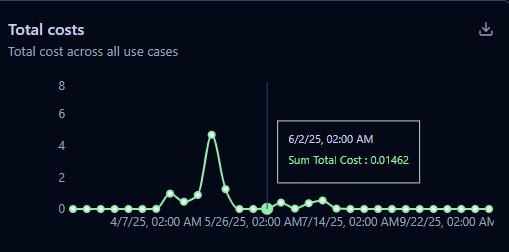
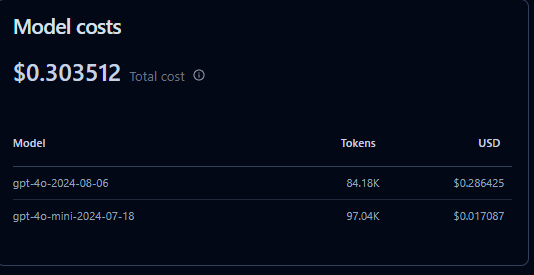
– Cost & Latency Tracking
LLM usage can get expensive quickly. Langfuse monitors token usage and costs across providers (OpenAI, Anthropic, etc.), helping teams optimize spend while balancing performance. You can also measure latency per request and pinpoint bottlenecks.
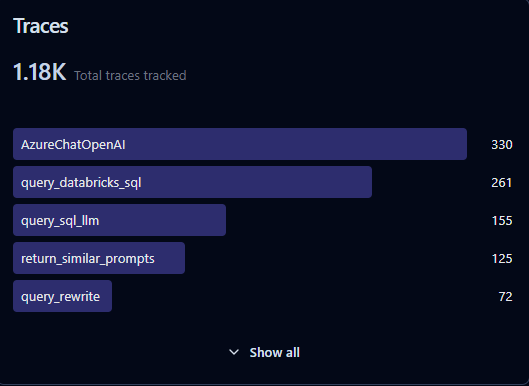
– Tracing Complex Workflows
Modern AI apps often chain multiple calls (retrieval → reasoning → generation → validation). Langfuse provides tracing and hierarchical logging so you can see how inputs move through your pipeline. Perfect for RAG, agents, or multi-step workflows.
– User Feedback Integration
The best way to improve an LLM app is to collect real-world feedback. Langfuse supports human-in-the-loop annotations, so you can tie user ratings or test labels directly back to traces. This data is gold for prompt tuning and fine-tuning.
– Evaluation & Experimentation
Langfuse makes it easier to run A/B tests on prompts or models, compare results side by side, and measure quality metrics like accuracy, toxicity, or hallucinations. This speeds up iteration and ensures data-driven improvements.
Setup and ease of use
– Local instalation with docker compose
One of the big wins with Langfuse is how easy it is to get started. You don’t need to spend days wiring up infrastructure-Langfuse provides a ready-to-run Docker Compose setup.
With just a single command, you can spin up Langfuse locally:
git clone https://github.com/langfuse/langfuse
cd langfuse
docker compose up
That’s it. You’ll have a fully functional instance with a UI, database, and backend services running on your machine.
This makes it simple to:
– Experiment quickly with traces and metrics.
– Run locally for development or testing.
– Deploy to production with minimal changes-just point your Docker stack to your preferred cloud provider.
– Langfuse’s setup lowers the barrier for teams that want observability without the ops headache.
Cloud Deployment
For teams that want to skip infrastructure management, Langfuse also provides a hosted cloud offering. With the cloud version, you get:
– Instant setup – no servers or Docker required.
– Scalability – resources automatically adapt as your usage grows.
– Managed updates & security – the Langfuse team handles maintenance.
– Collaboration – teammates can access dashboards and traces from anywhere.
First Logs
Langfuse provides an SDK you can integrate into your app to log prompts, responses, costs, and metadata. Once logged, you can view everything in the Langfuse dashboard (local or cloud).
Install the SDK
pip install langfuse
Set environment variables
You’ll need an API key and host. If you’re running Langfuse locally via Docker, defaults usually work. For Langfuse Cloud, you’ll get these from your account.
export LANGFUSE_SECRET_KEY="your-secret-key"
export LANGFUSE_PUBLIC_KEY="your-public-key"
export LANGFUSE_HOST="https://cloud.langfuse.com" # or http://localhost:3000 if self-hosted
Log a trace in Python
Here’s a minimal example with OpenAI’s GPT model:
from langfuse import Langfuse
from openai import OpenAI
# init clients
langfuse = Langfuse()
client = OpenAI()
# create a trace (represents one user request or workflow)
trace = langfuse.trace(
name="chatbot_conversation",
user_id="user_123"
)
# log an LLM call as a span inside the trace
span = trace.span(name="gpt_response")
# call the model
response = client.chat.completions.create(
model="gpt-4o-mini",
messages=[{"role": "user", "content": "Explain Langfuse in one sentence."}]
)
# log input/output to Langfuse
span.log_input({"prompt": "Explain Langfuse in one sentence."})
span.log_output({"response": response.choices[0].message.content})
print(response.choices[0].message.content)
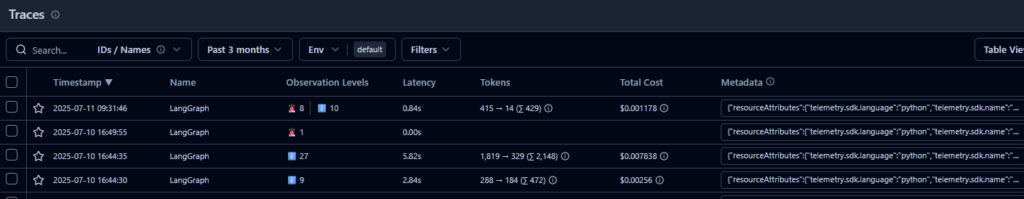
See results
- Open your Langfuse dashboard (Cloud or local).
- You’ll see the trace with prompt, response, tokens, latency, and metadata.