
Have you ever questioned how to query and analyze raw data as an AWS engineer? Moreover, have you ever tried doing that using Athena and QuickSight?
This blog post will guide you through the necessary steps to do that using Amazon services and tools. Amazon has a perfect combination of storage, transformation, and visualization that can help you accomplish your goal, i.e. data analyzing and visualizing.
The AWS services and tools that are needed are the following:
- Simple Storage Service (S3) is an online storage service where you can store and retrieve any type of data on the web regardless of the time and place.
- Amazon Athena is an interactive serverless service that can be used to query and analyze raw data using standard SQL. (You can read more about Athena here.)
- QuickSight is an AWS based Business Intelligence and visualization tool that is used to visualize data, perform ad hoc analysis and get business insights from our data. (You can read more about QuickSight here.)
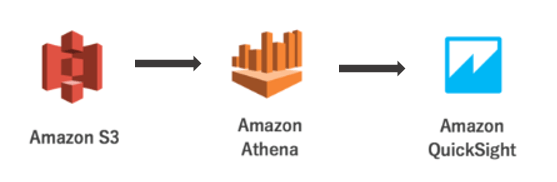
Let’s start with reviewing the data flow from left to right.
First, we upload our source file in S3, then we connect Athena with S3 in order to query the data and finally we use QuickSight to visualize the information.
Upload data to S3
- Create a new bucket.
- Create a new folder into that bucket because Athena needs folders inside a bucket to be able to access the data in it.
- Upload the source file into the previously created folder.
Create a table in Athena and query the data
There are three ways to access Athena: using the AWS Management Console, using the Amazon Athena API or using AWS CLI. For the purposes of this blog, we will use AWS Management Console. Before you start working with Athena please make sure that the region of Athena is the same as the region of the previously created S3 bucket, otherwise, you won’t be able to connect and query the data.
AWS Athena has a simple and easy to understand interface.
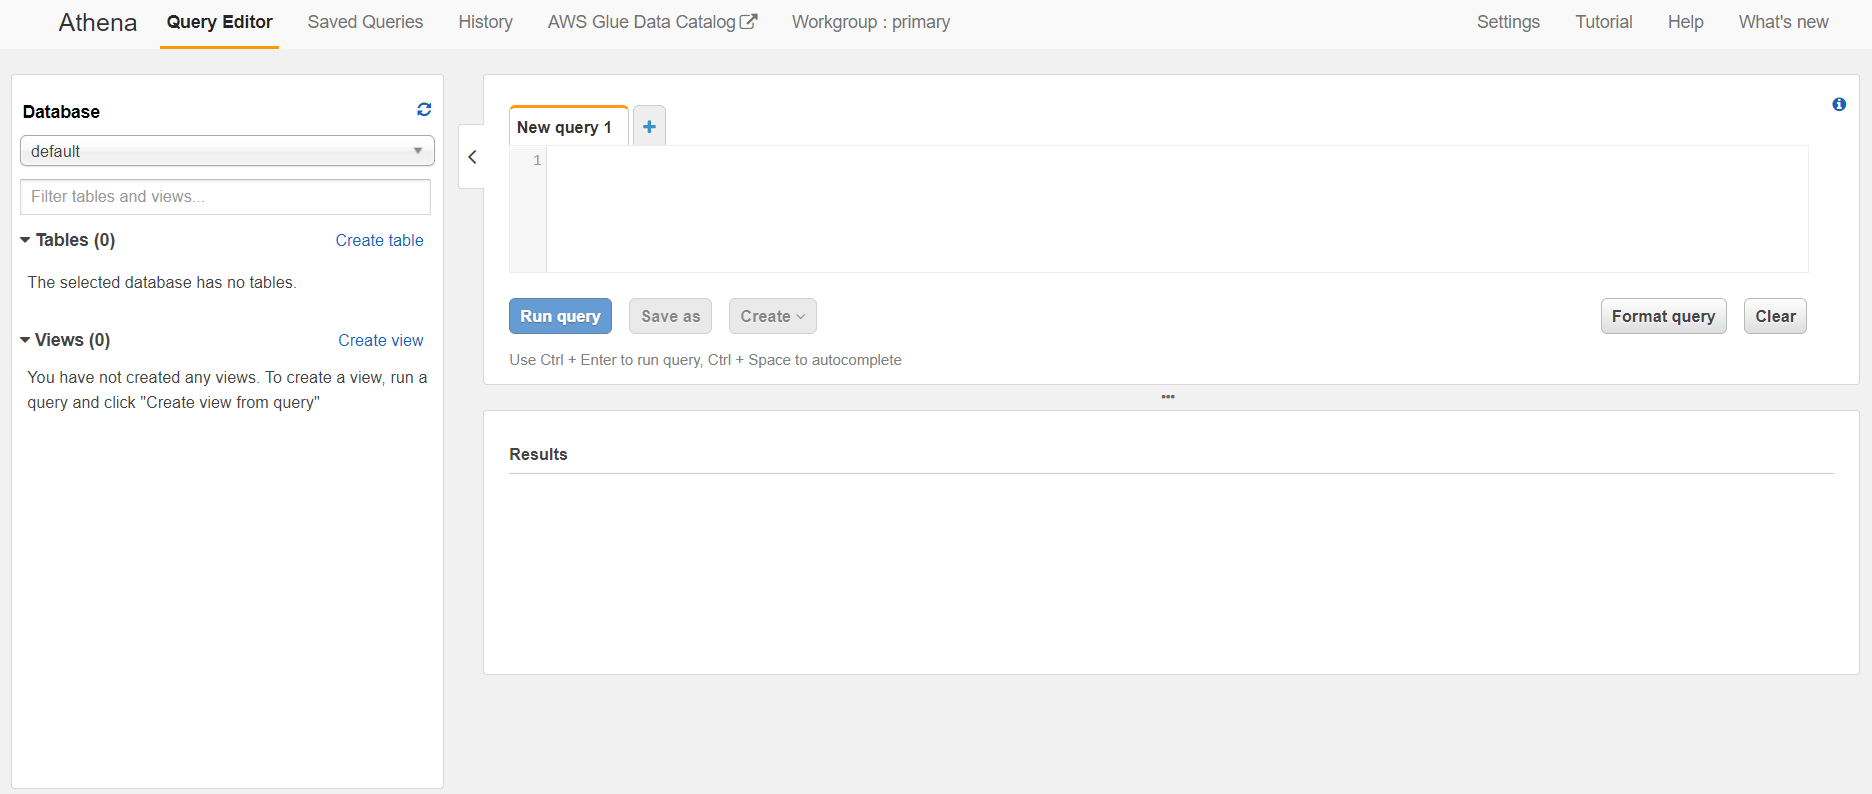
In the left section, you can see databases along with tables and views that are included in the selected database. The right section is intended for writing SQL queries, and the result of the query that we ran is displayed in the result section. Additionally, Athena allows us to save or format our query.
The menu structure is easy to navigate and includes five primary tabs: Query Editor, Saved Queries, History, AWS Glue Data Catalog, and Workgroup: primary.
So let’s start working with Athena. First, we have to create a table and there are multiple options to do that. We decided to create a table from S3 bucket data. Once we select that option, we will be redirected to a four-step process of creating a table.
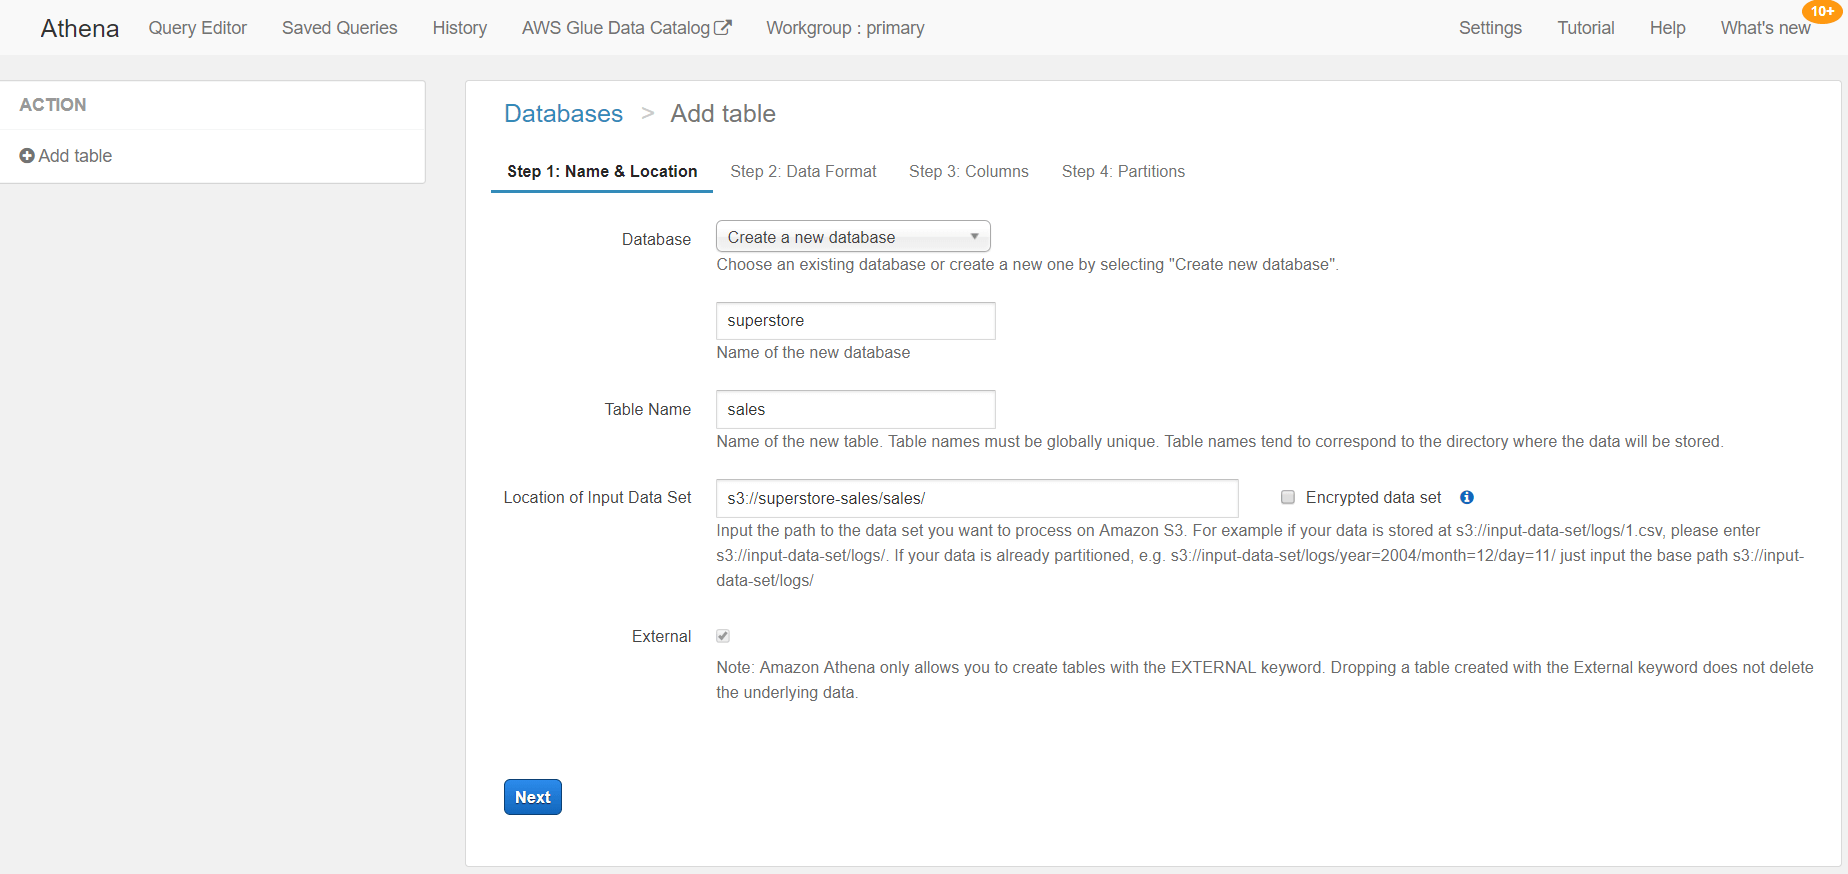
Step 1: Name & Location
In this step, we define the database, table name and the location of the input Data Set.
If you already have a database, you can select it from the drop-down list. If not, you can create a new database by selecting the option Create a new database and then you have to define its name. Next, we have to provide a name for the table. This name should be globally unique. After naming the table, we need to define the location of the source file. That’s where S3 comes into play. We have to define the folder path so we need to provide the bucket name and the folder name. Note that we cannot provide the file path, we can only provide the folder path.
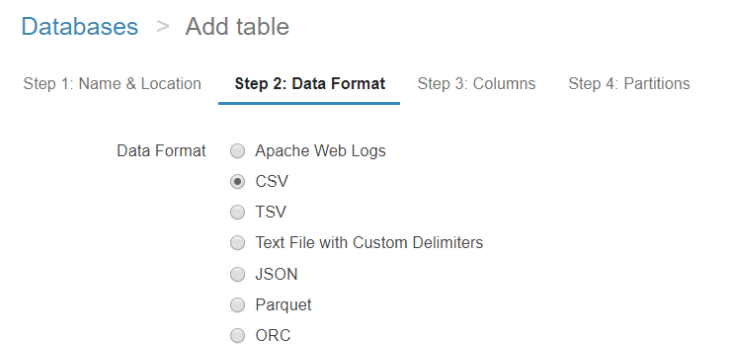
Step 2: Data Format
There are multiple data formats that we can access using Athena. In this example we will use CSV file, so we will select CSV as the data format.
Step 3: Columns
The source file doesn’t include column names, so in this step, we need to specify them. This is something that is required so that Athena knows the schema of the data we are working with. There are two ways to do that. One way is to simply type column name and column type for each column individually and the other way is to add columns in bulk as shown in the picture below.
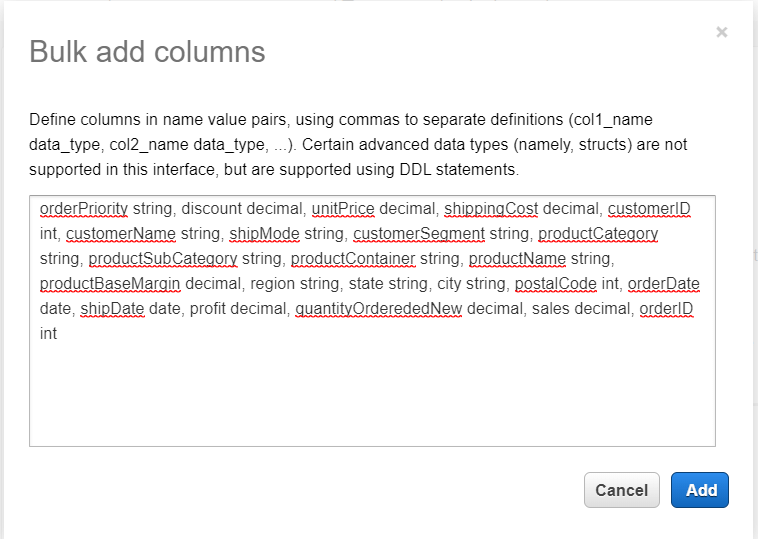
The second way is preferable when our data set has too many columns and it becomes tedious to configure each of them individually. The format is pretty simple. We have to specify the name of the column, followed by a space, followed by the type of data in that column. Column definitions are delimited using a comma.
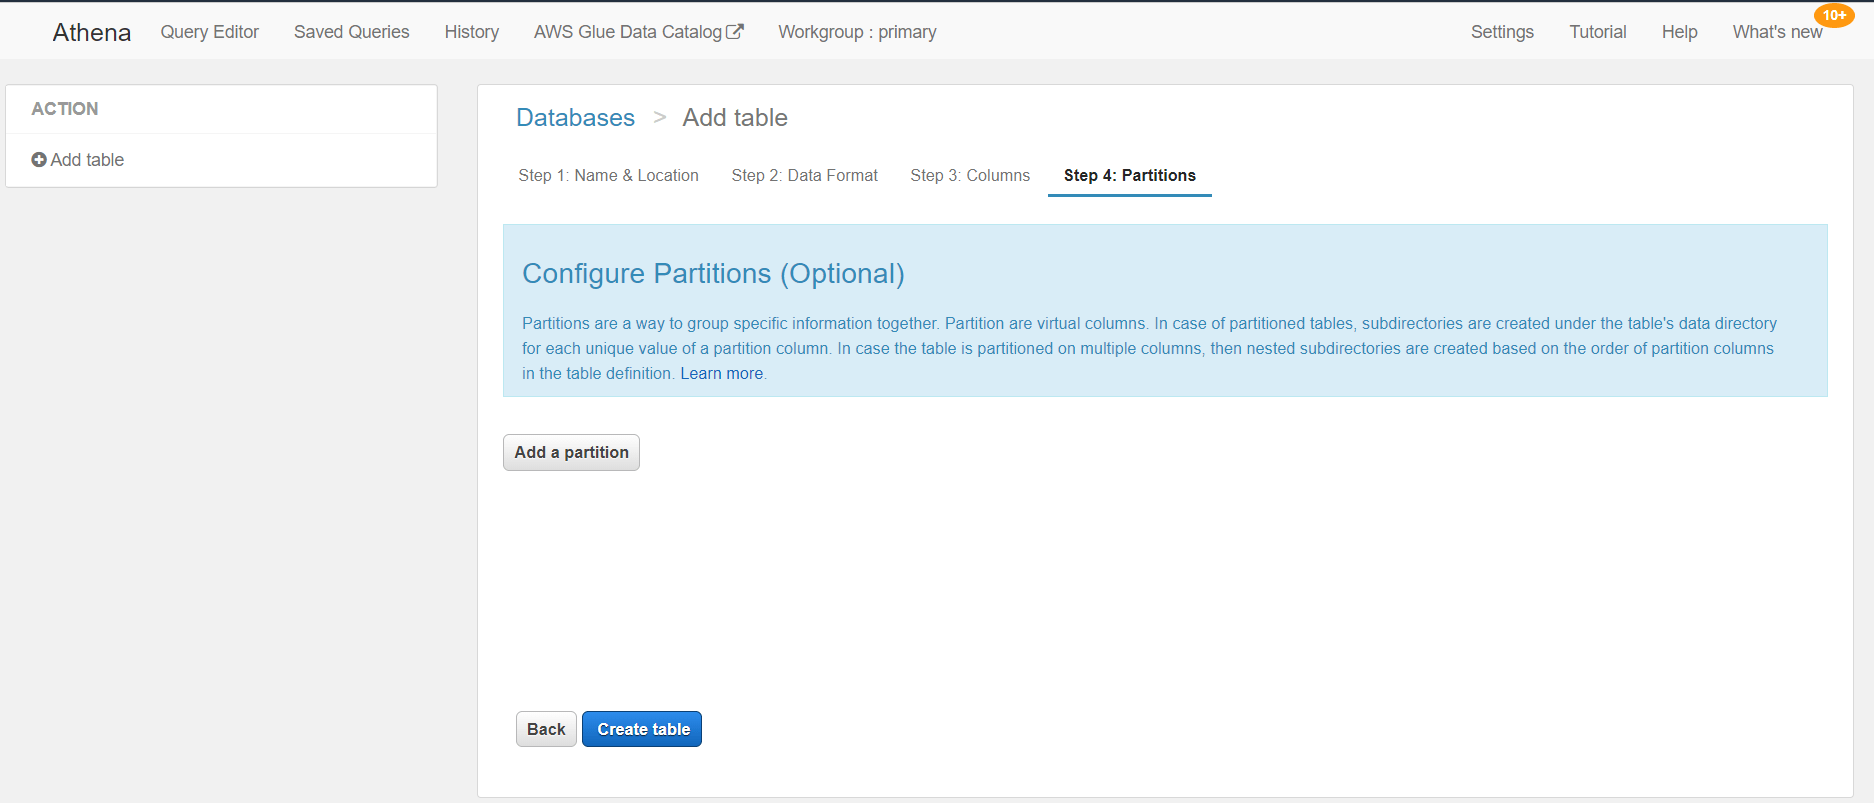
Step 4: Partitions
In this step, we can configure partitions. Amazon suggests partitioning data to reduce the amount of data that the query needs to scan. This can boost performance and lower query AWS costs. This is preferable if we have a big data set, but in our example, we have a small data set so this is not required.
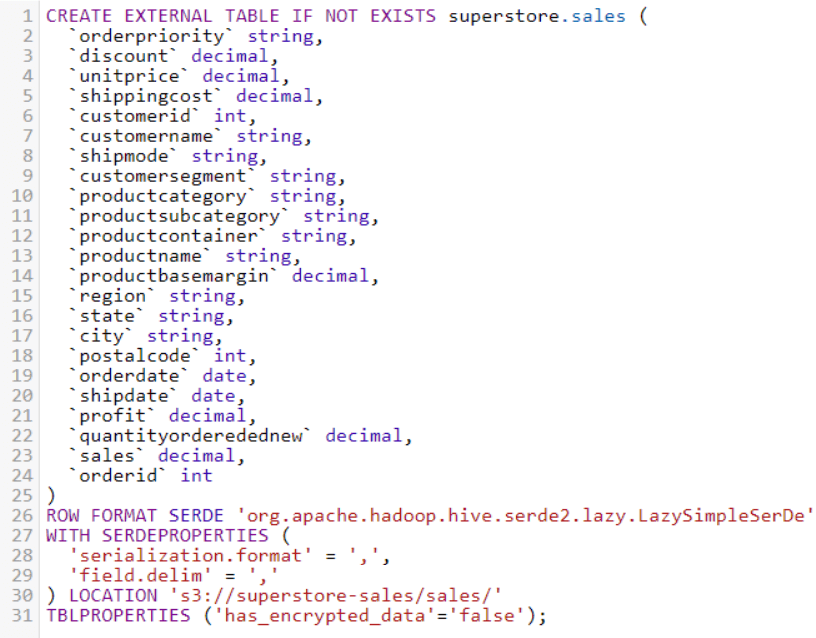
With this final step, we have finished the process of creating a table. We have created it using the Create Table Wizard, but this is not the only way to do this. Athena also allows us to create tables using DDL statements as shown in the picture below.
What’s left now is to query the table and see if the configuration is proper. To test this out, we’ll run this simple SQL query:
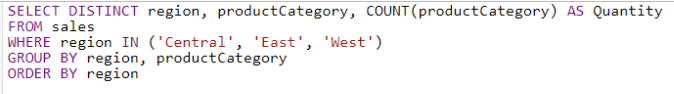
After running this query in the result section we are able to see the output which is displayed on the picture below. Output files are saved automatically for every query that runs regardless of whether the query itself was saved or not.
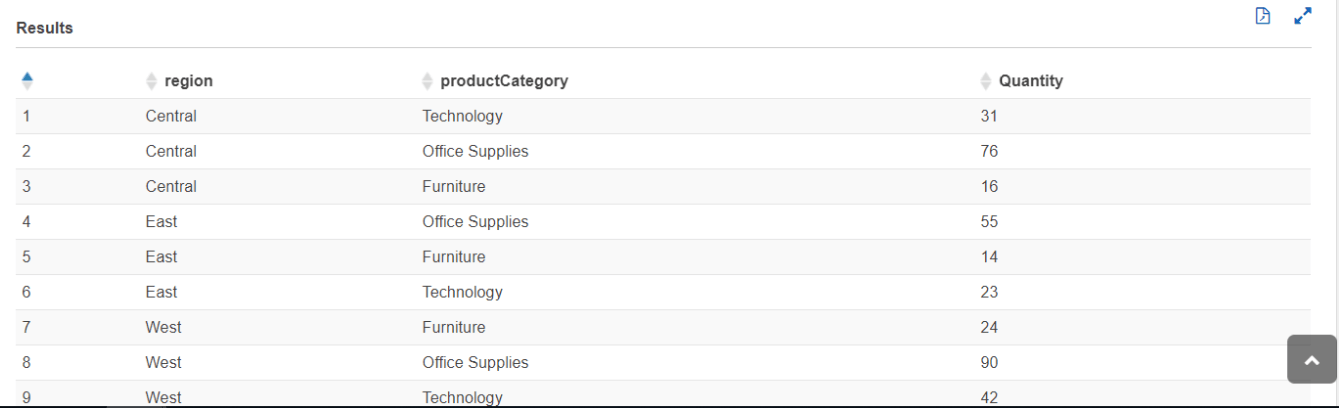
Additionally, by choosing the file icon in the Results section we can download the query result file in a CSV format. Also, we can download it from the query History tab.
Visualize Data with Amazon QuickSight
For the purpose of visualizing the data, we are using AWS Quicksight. But, besides AWS Quicksight, you can also use Tableau, Looker, Mode Analytics, and others for advanced reports and visualizations. In our case, we will use QuickSight. It is an AWS based Business Intelligence and visualization tool that is used to visualize data, perform ad hoc analysis and get business insights from our data. Data is entered as a dataset. It uses AWS’ Super-fast, Parallel, In-memory Calculation Engine (SPICE) to quickly perform data calculations and create graphs. Amazon QuickSight loads data from Athena, S3, RDS, RedShift, MySQL, Snowflake and many others.
If you have never worked with QuickSight before, you have to create an account. Before you connect it with Athena, please make sure that QuickSight has the right to access the information. You have to allow QuickSight to access Amazon Athena and S3. If QuickSight doesn’t have these rights then we won’t be able to analyze and visualize the data that we queried in Athena. Also, another important thing is the region. The region that we selected for QuickSight must be the same as the region that we selected for Athena, otherwise, the data that we have in Athena cannot be accessed by QuickSight.
There are numbers of visualization or graphical formats that are available. We can choose various charts like the Bar chart, Pie chart, Donut chart, Line chart etc.
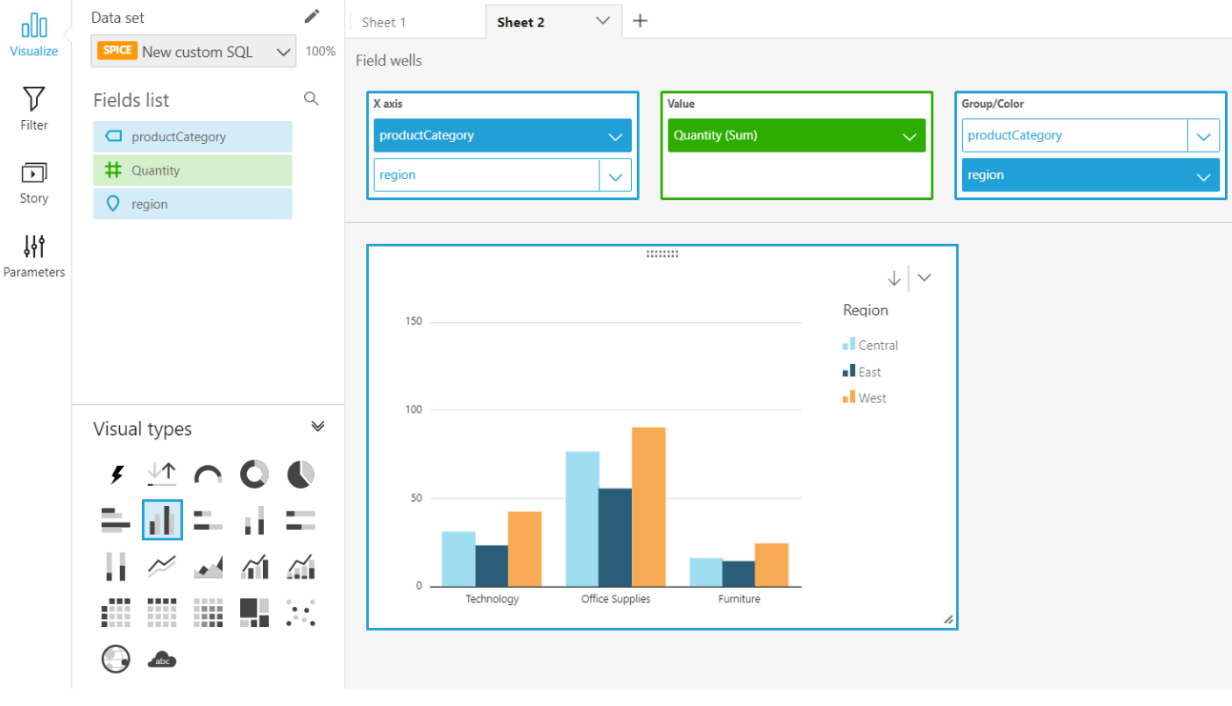
In the picture above we have used the vertical bar chart to effectively visualize the data that we previously queried in Athena. The dashboard gets automatically updated as the data is updated or scheduled.
Conclusion
AWS Athena is used to quickly and easily run queries without having to set up and manage any servers or data warehouses. This service is the right choice if you have to analyze huge data sets. In this blog we used S3 to store the data, then we connected Athena with S3 in order to query the data and finally, we used QuickSight to visualize the information.