

When AWS announced CloudWatch Insights, I had a great expectations to solve grand portion of the problems I have when using CloudWatch logs – and I use them a lot.
First, just based on the service name, I expected that search inside the logs will be more user friendly and quicker. So, if you are here about the search – stop, don’t go further. AWS CloudWatch Insights is not about searching data. So, the old problem with quick search in logs still exist. Best approach to make your life more bearable is to have good standardized logs with keywords and good json structure.
AWS CloudWatch is about log analytics. AWS announces the General Availability of CloudWatch Logs Insights on 27th November during re:Invent 2018. As AWS says, CloudWatch Logs Insights enables you to explore, analyze, and visualize your logs instantly. Yes, query results are really quick and you only pay for the queries you run. In addition, you can publish log-based metrics, create alarms, and correlate logs and metrics together in CloudWatch Dashboards for complete operational visibility.
It allows you to create queries with aggregations, filters, and regular expressions.
I’ll try to find out:
- How many errors are out there from running my lambda function;
- How much I’m billed for running Lambda function and if there is a place to optimize it;
Just a little information about the Lambda function that I’ll use. This Lambda function is called from proxy API and inside it handles 20+ operations, mainly calling on-premise API’s or CRUD operations for on-premise databases. No heavy calculations or processing inside, only re-mapping of data.
Many times, a client is claiming that the Lambda function is slow with bad response time or error message in response. I’ve set up X-Ray for detailed analytics to find out that external API’s have latency in response, which cause a lot of problems. What I’ve done back then – raised execution memory and timeout period. But, how far did I go? How much I’m billed unnecessarily? Let’s find it out.
First, I’m interested how many errors are out there in the last day knowing that QA team was performing stress test.
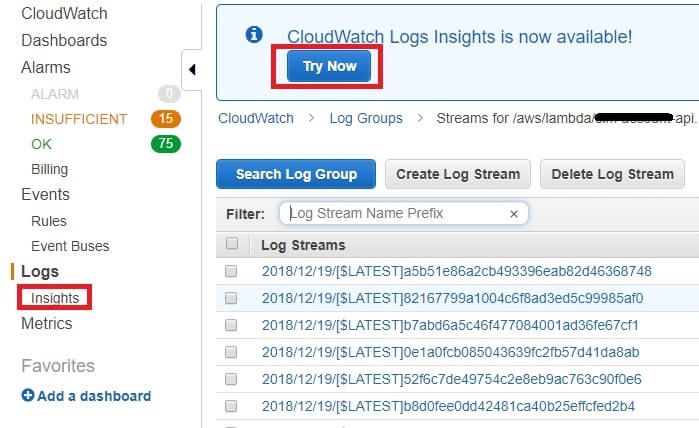
I’ll navigate to my Lambda function -> CloudWatch logs. Here, you can see the new operation that is available – CloudWatch Logs Insights:
Let’s navigate to the CloudWatch Logs Insights console:
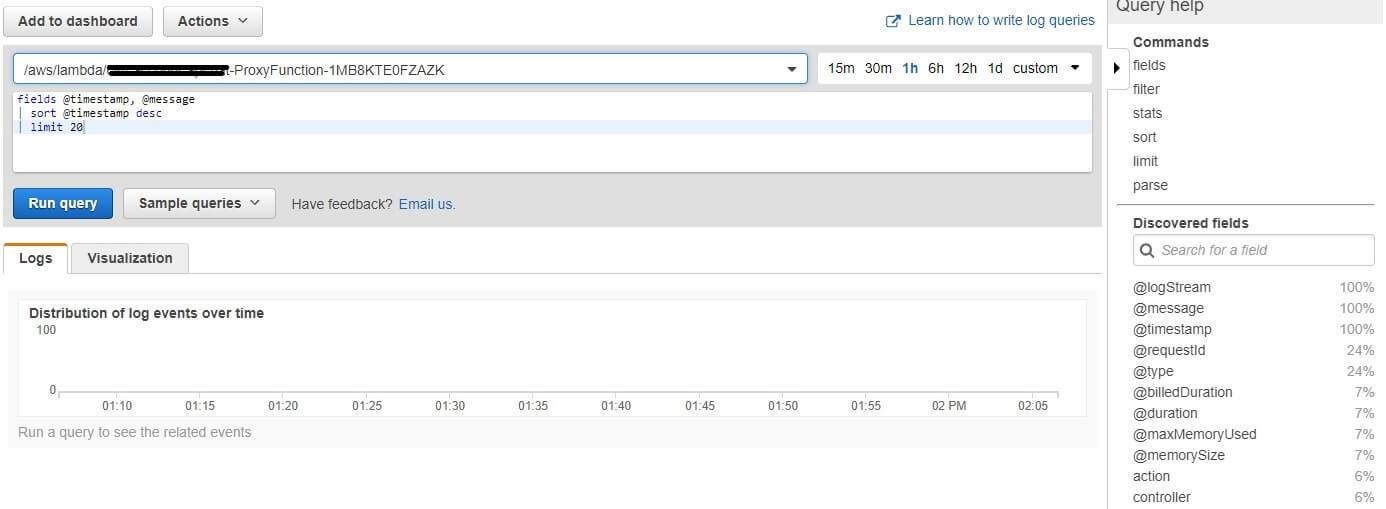
I want to see a list of the number of exceptions per hour in the last 24h. Next to Log group name, I chose 1d and run the following query:
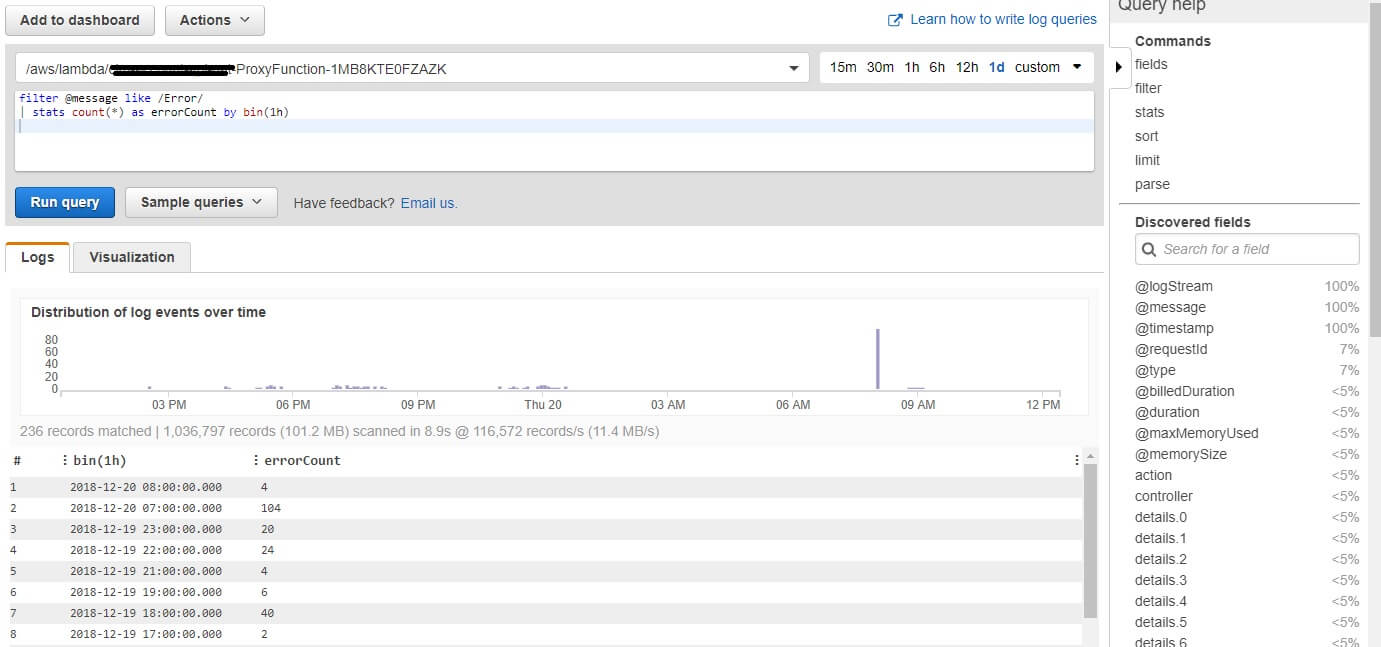
filter @message like /Error/
| stats count(*) as errorCount by bin(1h)
This query returns me a number of messages that contain Error in text (that is how my log is structured) grouped hourly using bin(). I can preview as a line or stacked area graph. Bin() helps you quickly visualize trends in log events over time.
Or using visualization:
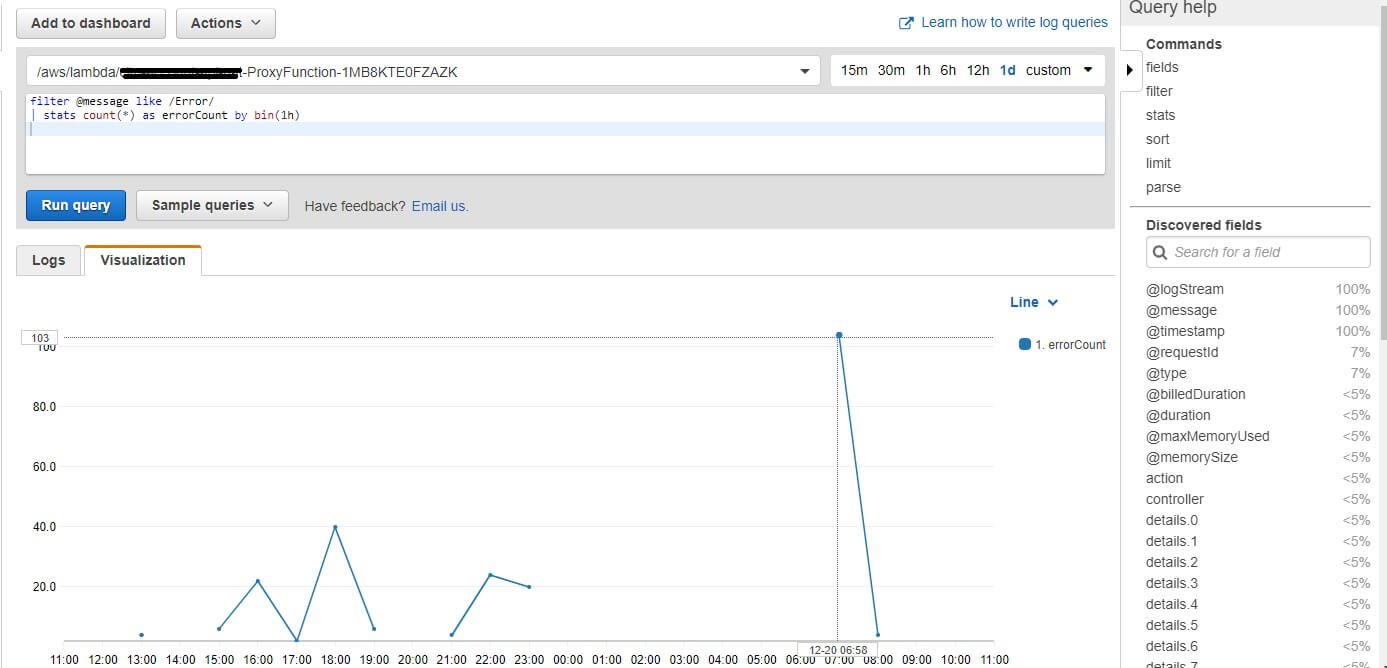
Stress test was around 7 o’clock, when Lambda function produces 104 errors. I’m interested what kind of errors are there:
fields @timestamp, @message, @logStream
| filter @message like /Error/
From the results I can find the error details and log stream – if I want to see full request info:
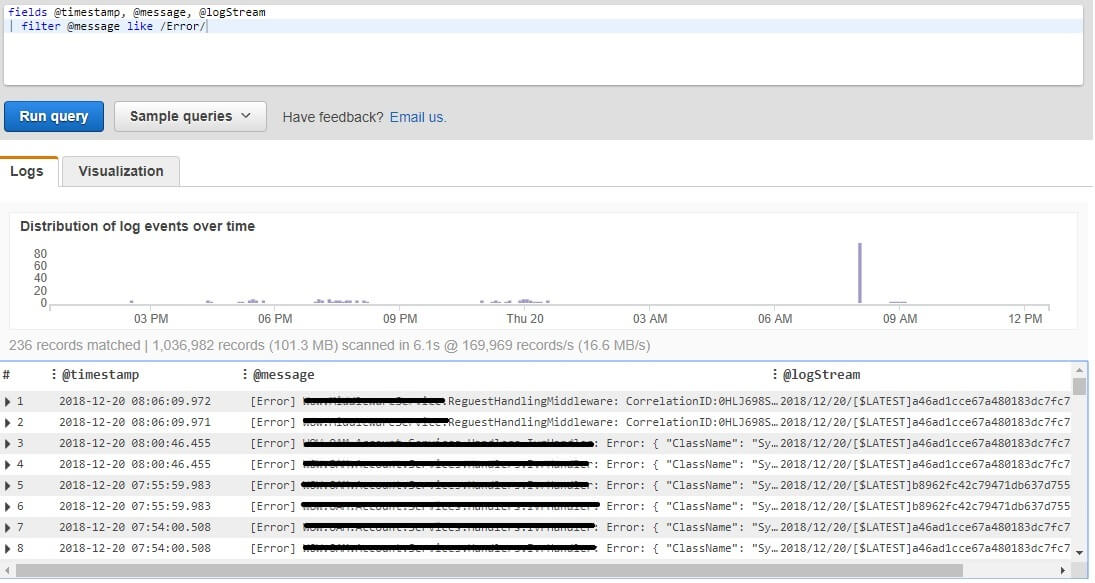
All the errors in the time of performance testing were wrappers to the external systems errors.
Second type of information that I’m interested in is billed time and real time of Lambda execution. This information is available after each processed request in CloudWatch under Report record type:
fields @message, @duration, @billedDuration |
filter @type = "REPORT"
The result is a list of all REPORT records:
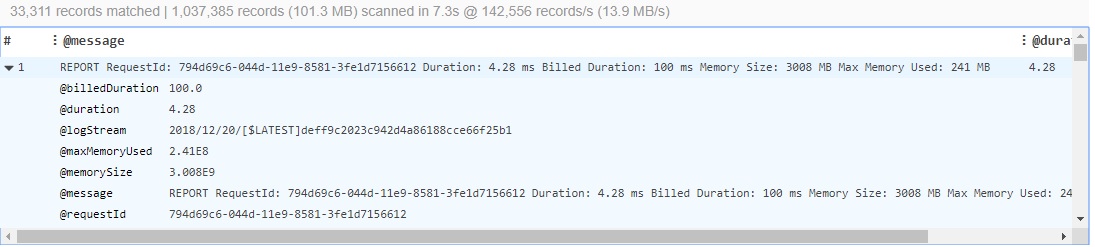
From the sample above I can say that for this request I’ve paid 96% more that I’ve used – Lambda function runs 4.28 ms and I was billed for 100 ms. Let’s see results on a bigger set:
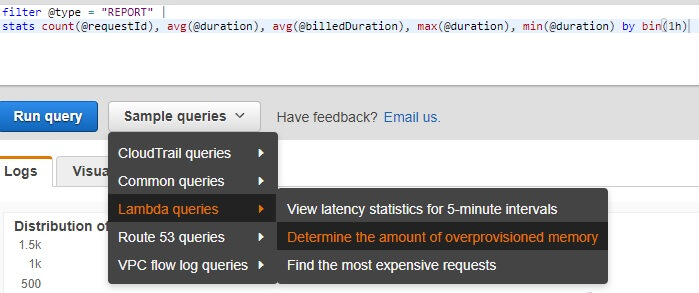
filter @type = "REPORT" |
stats count(@requestId), avg(@duration), avg(@billedDuration), max(@duration), min(@duration) by bin(1h)
Results more or less confirm that based on my current Lambda function configuration I’m billed more than what I’m using:
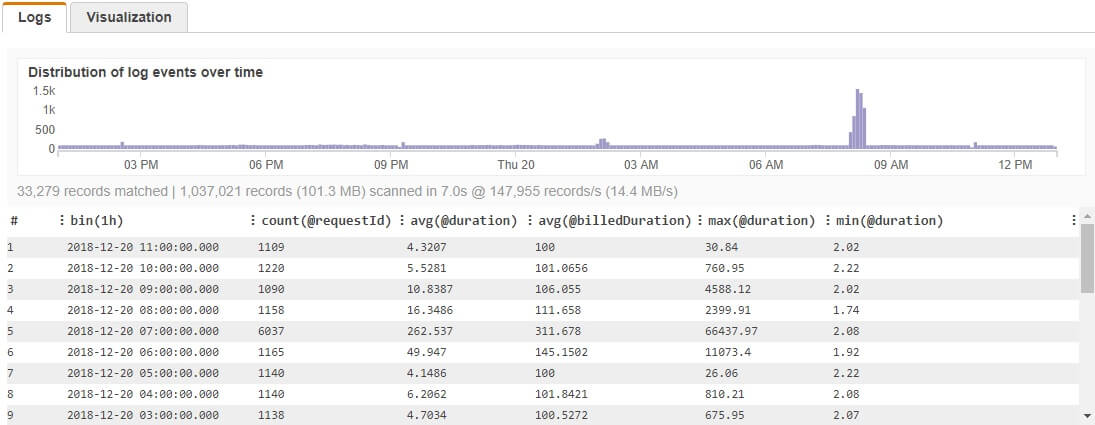
Except the time interval when performance testing was conducted, I usually have average 1100 requests hourly, with average duration of 5ms. Let’s see the memory status. I’m using build-in query for over-provisioned memory:
filter @type = "REPORT"
| stats max(@memorySize / 1024 / 1024) as provisonedMemoryMB,
min(@maxMemoryUsed / 1024 / 1024) as smallestMemoryRequestMB,
avg(@maxMemoryUsed / 1024 / 1024) as avgMemoryUsedMB,
max(@maxMemoryUsed / 1024 / 1024) as maxMemoryUsedMB,
provisonedMemoryMB - maxMemoryUsedMB as overProvisionedMB

I have 2439MB overprovisioned memory. Average memory that is used from Lambda function id 242 MB, and my Lambda function is set up to 3008 MB. This affects my billed time and needs to be changed, especially because I do not have heavy calculations and processing inside.
Conclusion
Performance and cost optimization are still an open issue in the serverless world. There is still no objective way of measuring and optimizing execution, due to many factors that are outside our control. I hope this CloudWatch Logs Insights can help us take more data-driven decisions, and save some time while optimizing our Lambda Functions.
References:
https://docs.aws.amazon.com/AmazonCloudWatch/latest/logs/AnalyzingLogData.html
https://aws.amazon.com/blogs/aws/new-amazon-cloudwatch-logs-insights-fast-interactive-log-analytics/