

This article describes how to create Jenkins pipeline using Blue Ocean for parallel test execution of API tests implemented with JMeter and UI tests implemented with Selenium Web Driver.
Introduction
The Blue Ocean UI aims to improve clarity, reduce clutter and navigational depth to make the user experience very concise. It can be installed side-by-side with the Jenkins Classic UI via a plugin. Blue Ocean Pipelines are visualized on screen along with the steps and logs to allow simplified comprehension of the continuous delivery pipeline – from the simple to the most sophisticated scenarios. Scrolling through 10,000 line log files is a thing of the past, Blue Ocean breaks down your log per step and shows where your build failed.
Creating Stages and Executing the Blue Ocean Pipeline
Blue Ocean’s Dashboard is the default view shown when you open Blue Ocean, if you have previously configured Pipelines. If not, Blue Ocean scans the repository for a Jenkinsfile, and when Jenkinsfile is not found, it notifies you with a message (Figure 1), and you will be prompted to create Jenkinsfile manually, i.e. by adding stages and steps.
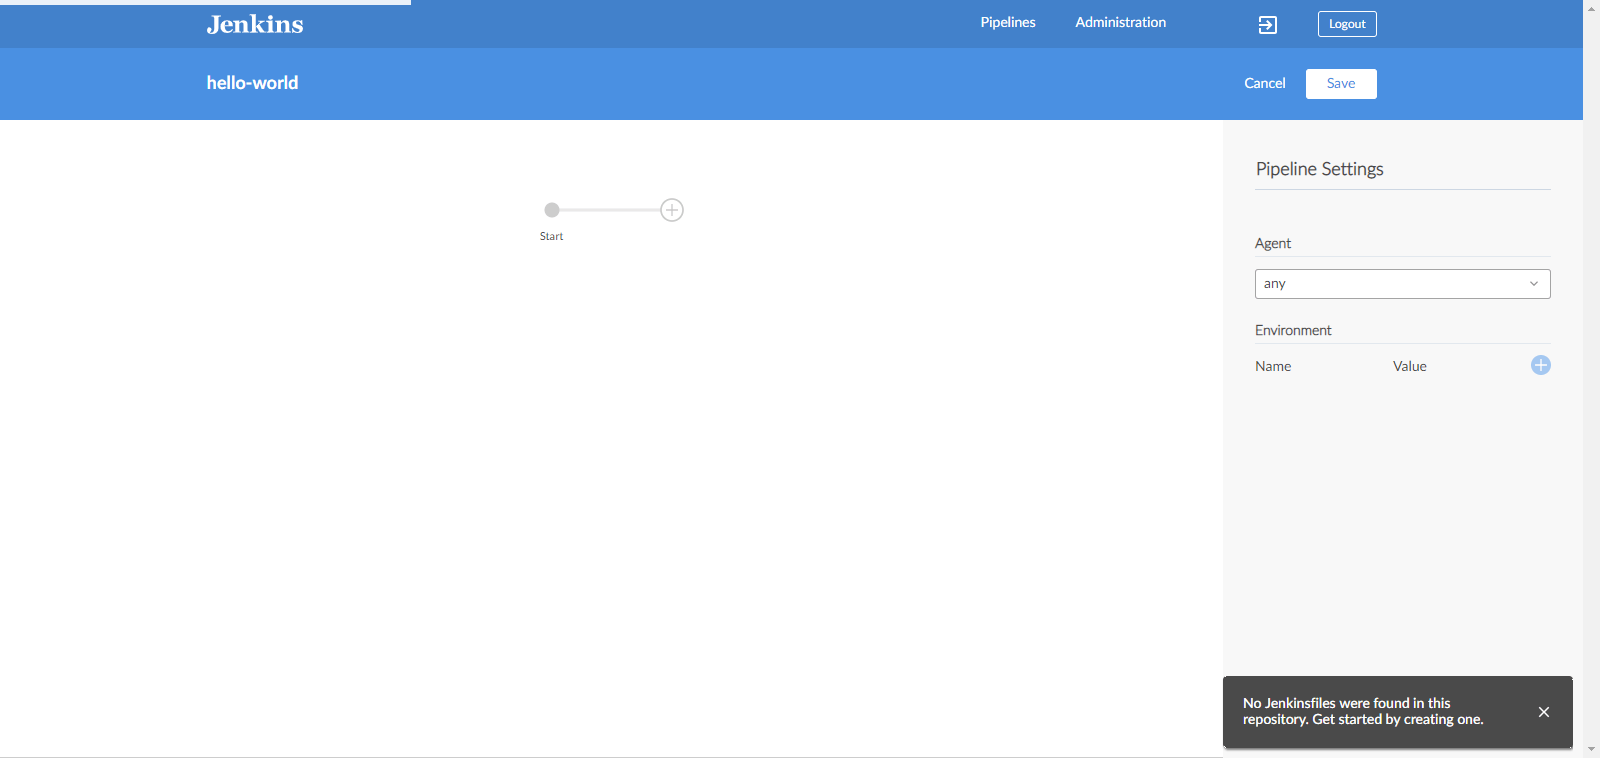
(Figure 1 – No Jenkinsfile notification message)
Creating pipeline in Blue Ocean is the simplest and easiest way for anyone to start creating Pipelines in Jenkins. The editor allows users to create and edit Pipelines, add stages and parallel tasks that can run at the same time. When finished, the editor saves the Pipeline to a source code repository as a Jenkinsfile. If the Pipeline needs to be changed again, Blue Ocean makes it easy to jump back in into the visual editor to modify the Pipeline at any time (Figure 2).
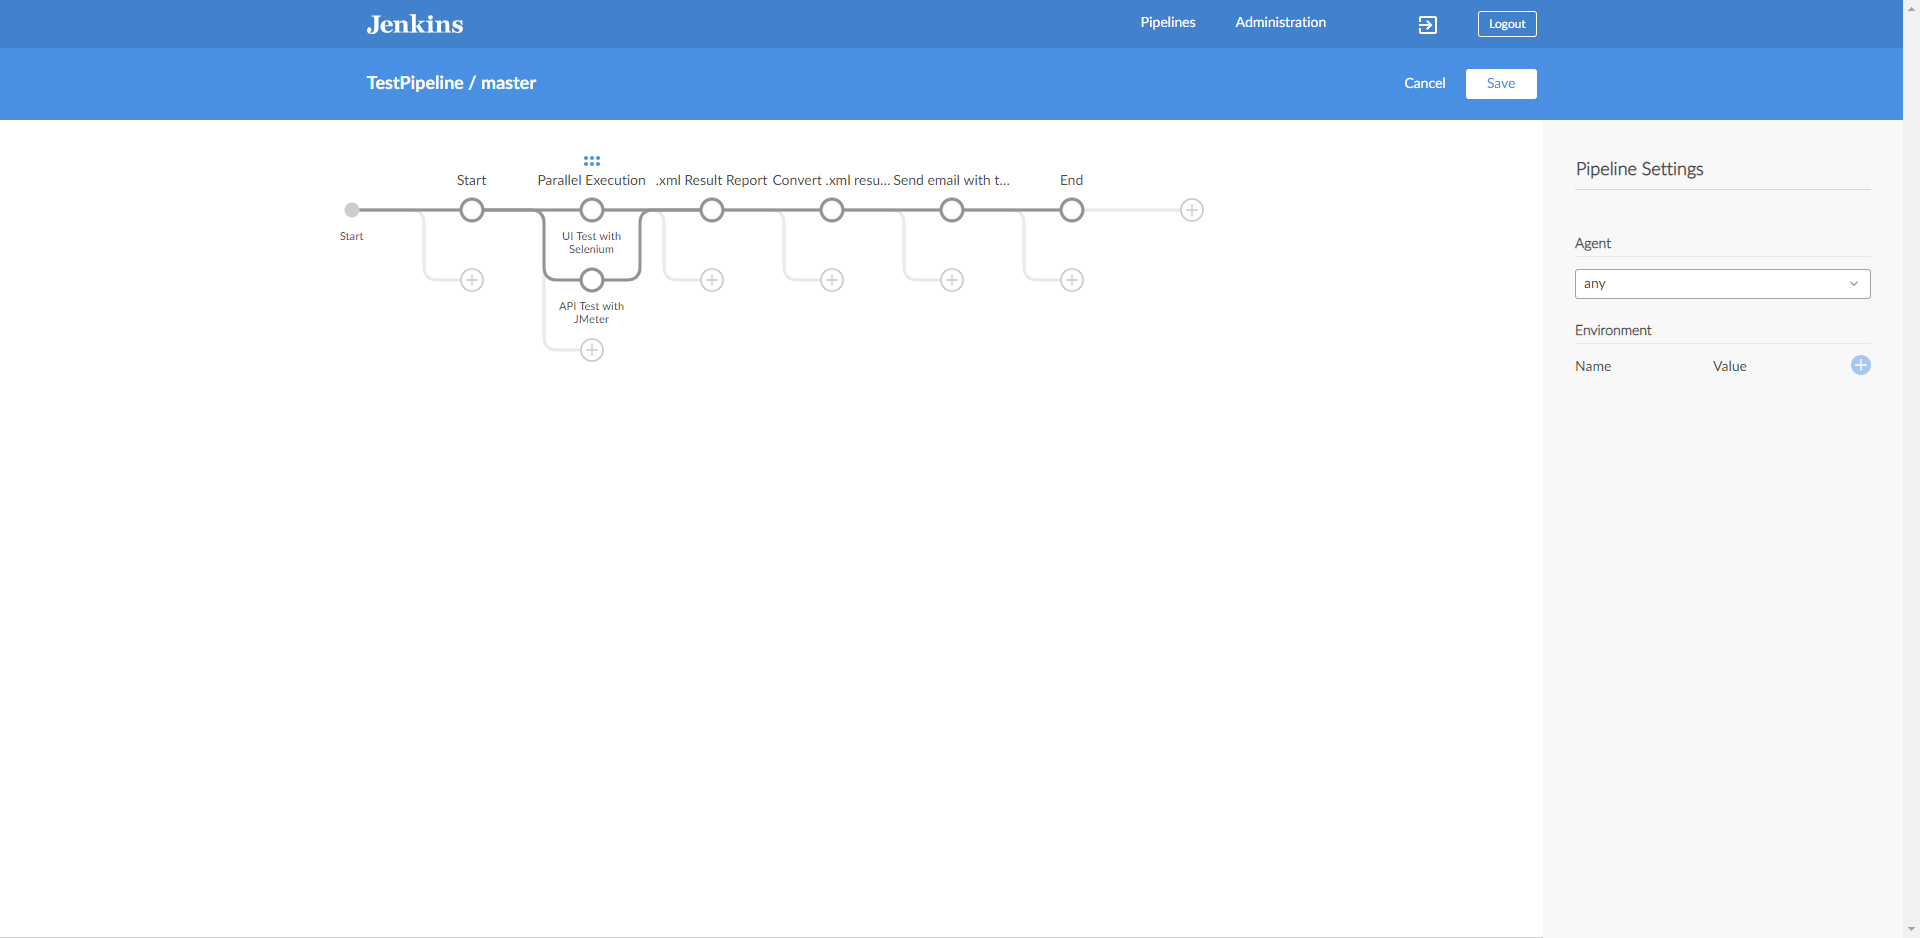
(Figure 2 – Blue Ocean Pipeline)
The navigation bar on this screen is consisted of:
- Pipeline Name – which shows the name and the branch
- Cancel – to discard the changes made
- Save – saves the changes made to the pipeline and runs it.
Pipeline Stage(s)
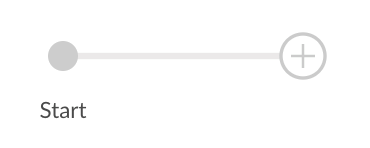
Stages in the Pipeline, can be added by clicking on the “+” button (Figure 3). If there are previously created pipelines, you can edit the pipeline, i.e. add or remove stages (Figure 4). The Stage editor will display the name of each Stage once it has been set. Stages that contain incomplete or invalid information will display a warning symbol. Pipelines can have validation errors while they are being edited, but cannot be saved until the errors are fixed.
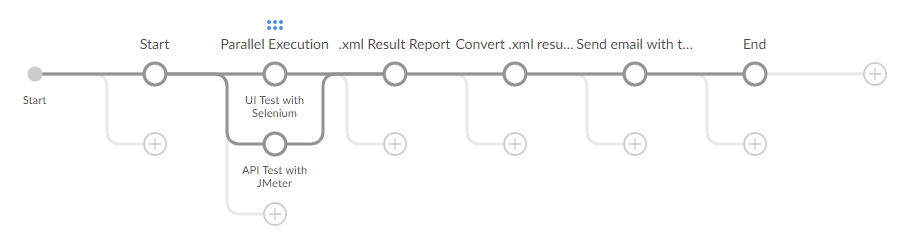
(Figure 4 – Blue Ocean Pipeline with many stages)
Stage and Step Configuration
Click on the “+” button to add stage. Selecting a stage in the Stage editor will open the “Stage Configuration” sheet on the right side. (Figure 5) . Here we can add name or change the existing name of the Stage, delete the Stage, and add steps to the Stage. The name of the Stage can be set at the top of the Stage Configuration sheet, while those can be deleted from the context menu (three dots on the upper right).
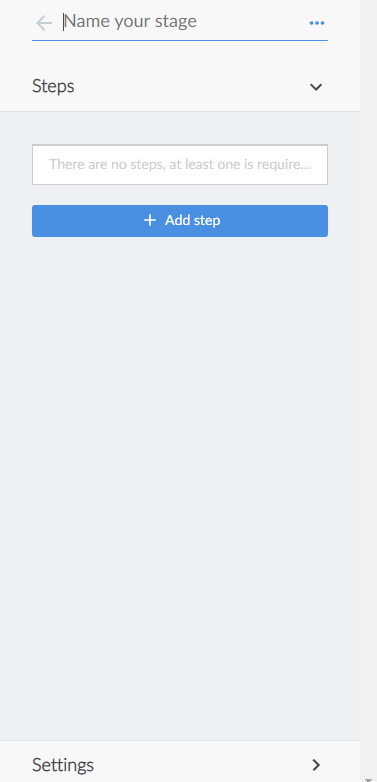
(Figure 5 – Stage configuration sheet)
Clicking “Add step” button will display the list of available step types (Figure 6) with a search bar at the top. Adding a step or selecting an existing step will open the step configuration sheet.
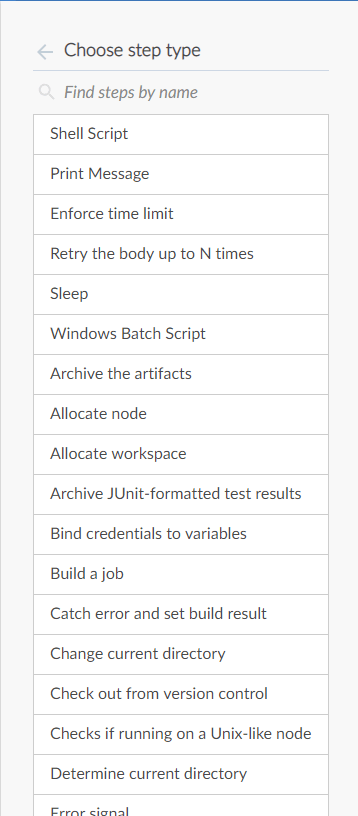
(Figure 6 – List of step types)
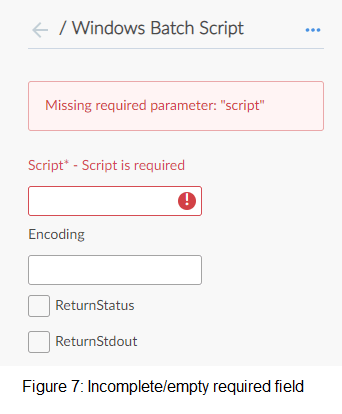
The name of the step cannot be changed. The context menu (three dots on the upper right), can be used to delete the current step. For the Fields that contain incomplete/invalid information or they are left empty, a warning symbol will be displayed (Figure 7). Pipelines can have validation errors while they are being edited, but cannot be saved until the errors are fixed.
In the first stage (Figure 8) there will be first step not displayed, but added automatically, check out from version control, which gets the last committed code. Other than that, we will add two more steps:
- Print message – “Start execution”.
- Windows Batch Script, which contains clean command just to be sure that it will clean all the cached output and to always get the latest code for deployment.
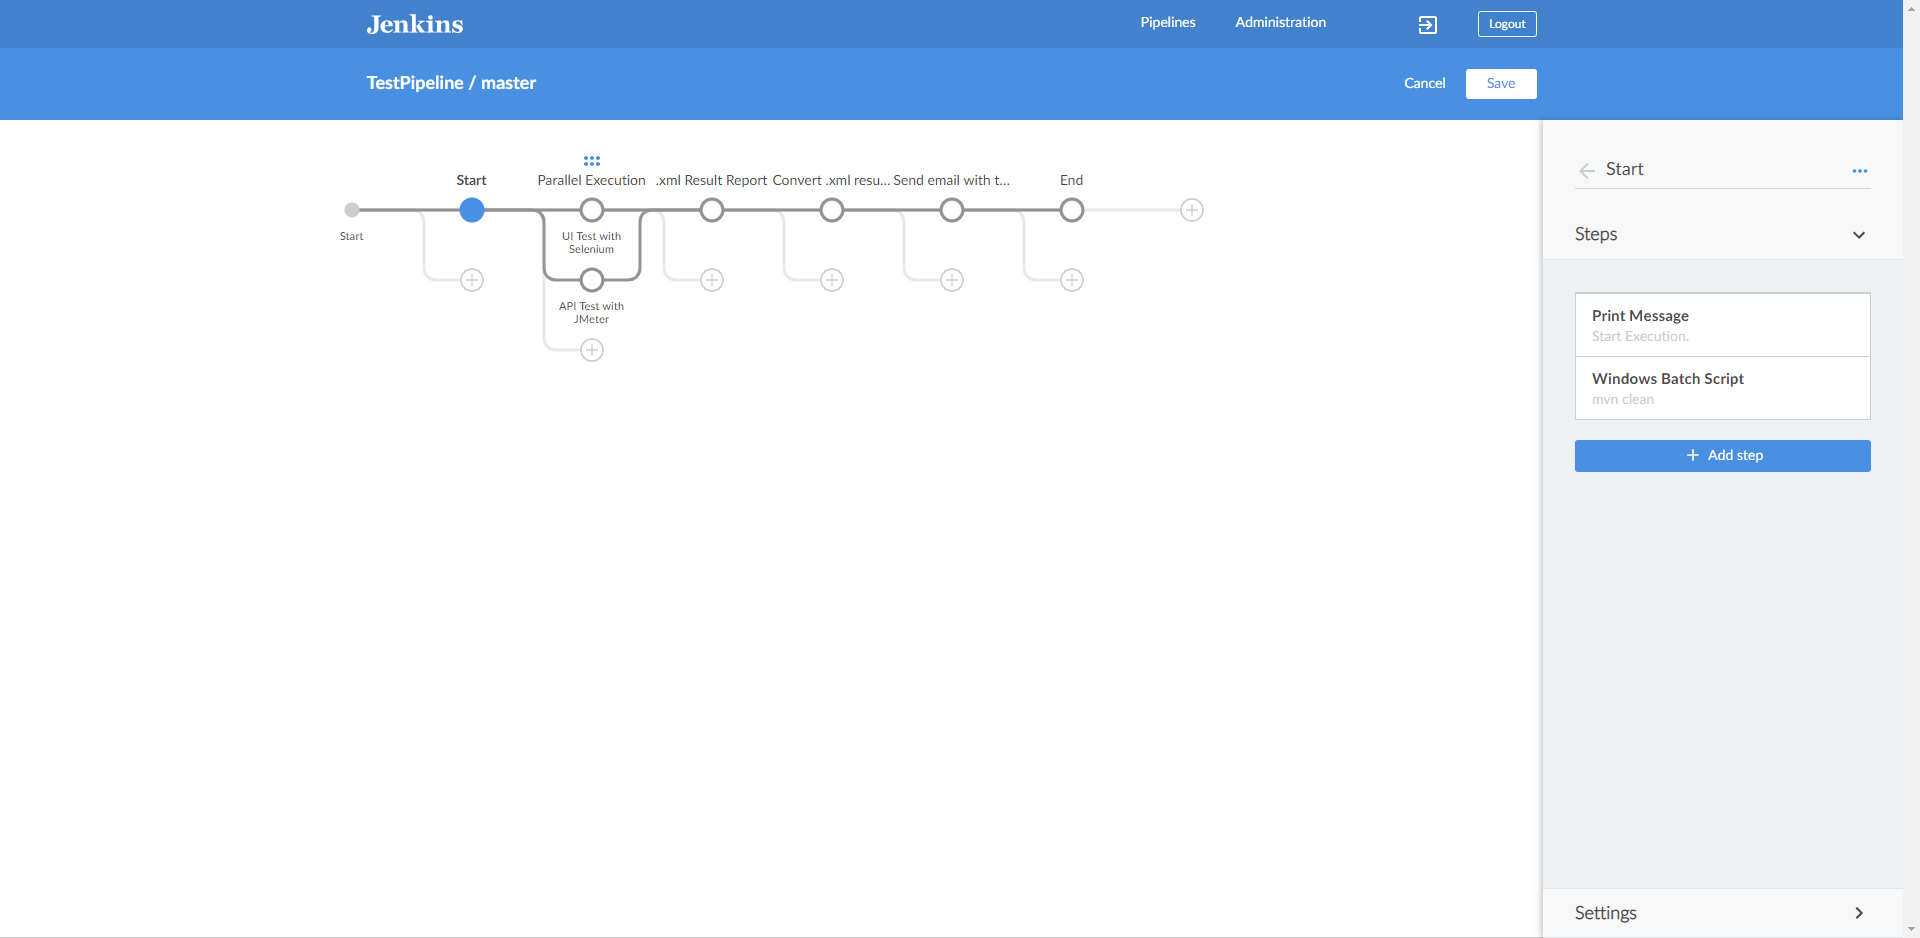
(Figure 8 – First stage)
The second stage will have 2 parallel tasks. In order to make tasks to run parallel, click on the “+” button below the first task. In this Pipeline, we will execute two types of tests (API and UI) in two different tasks that will run at the same time. The first task from the second stage – 2a (Figure 9), will execute previously created Maven project with Selenium. We will have two steps:
- Windows Batch Script which contains maven command to execute the test suite
- Print Message – print on the console that the run is done.
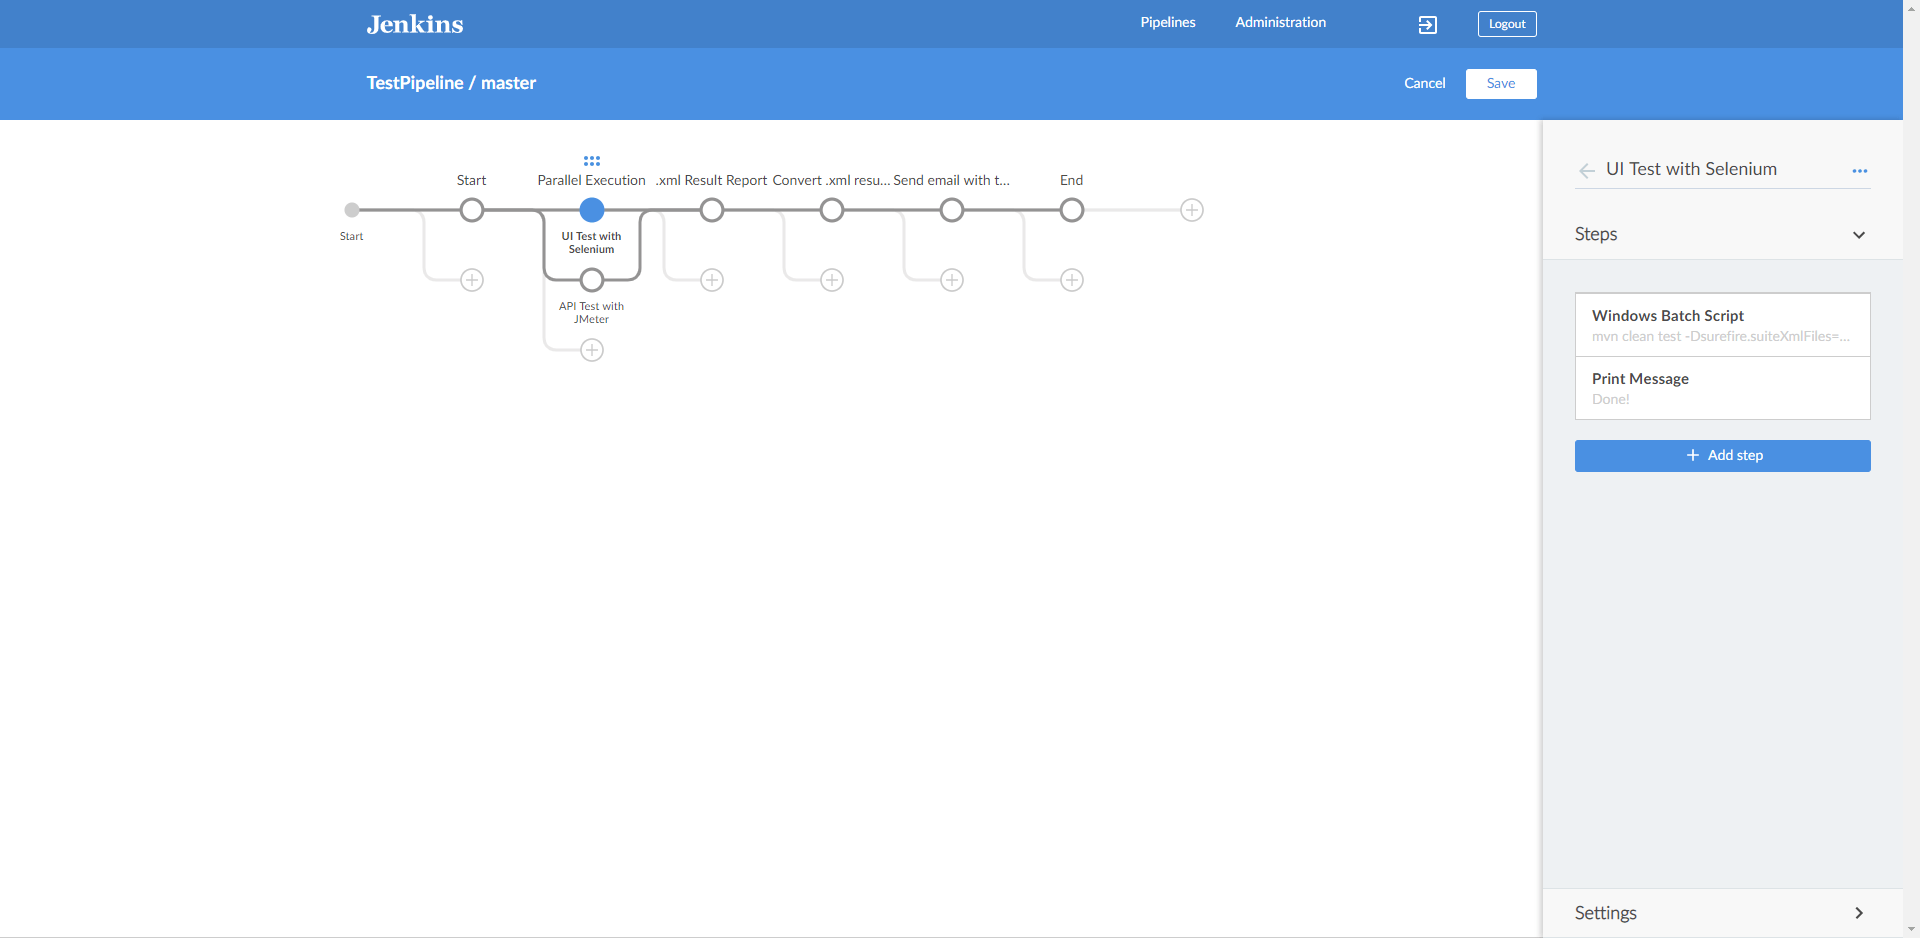
(Figure 9 – Second stage – task 2a)
The second task from the second stage – 2b (Figure 10), will execute previously created JMeter API Tests with ANT script. In that stage, we will have two steps:
- Windows Batch Script command that executes the JMeter API tests with ANT script.
- Print Message – print on the console that the run is done.
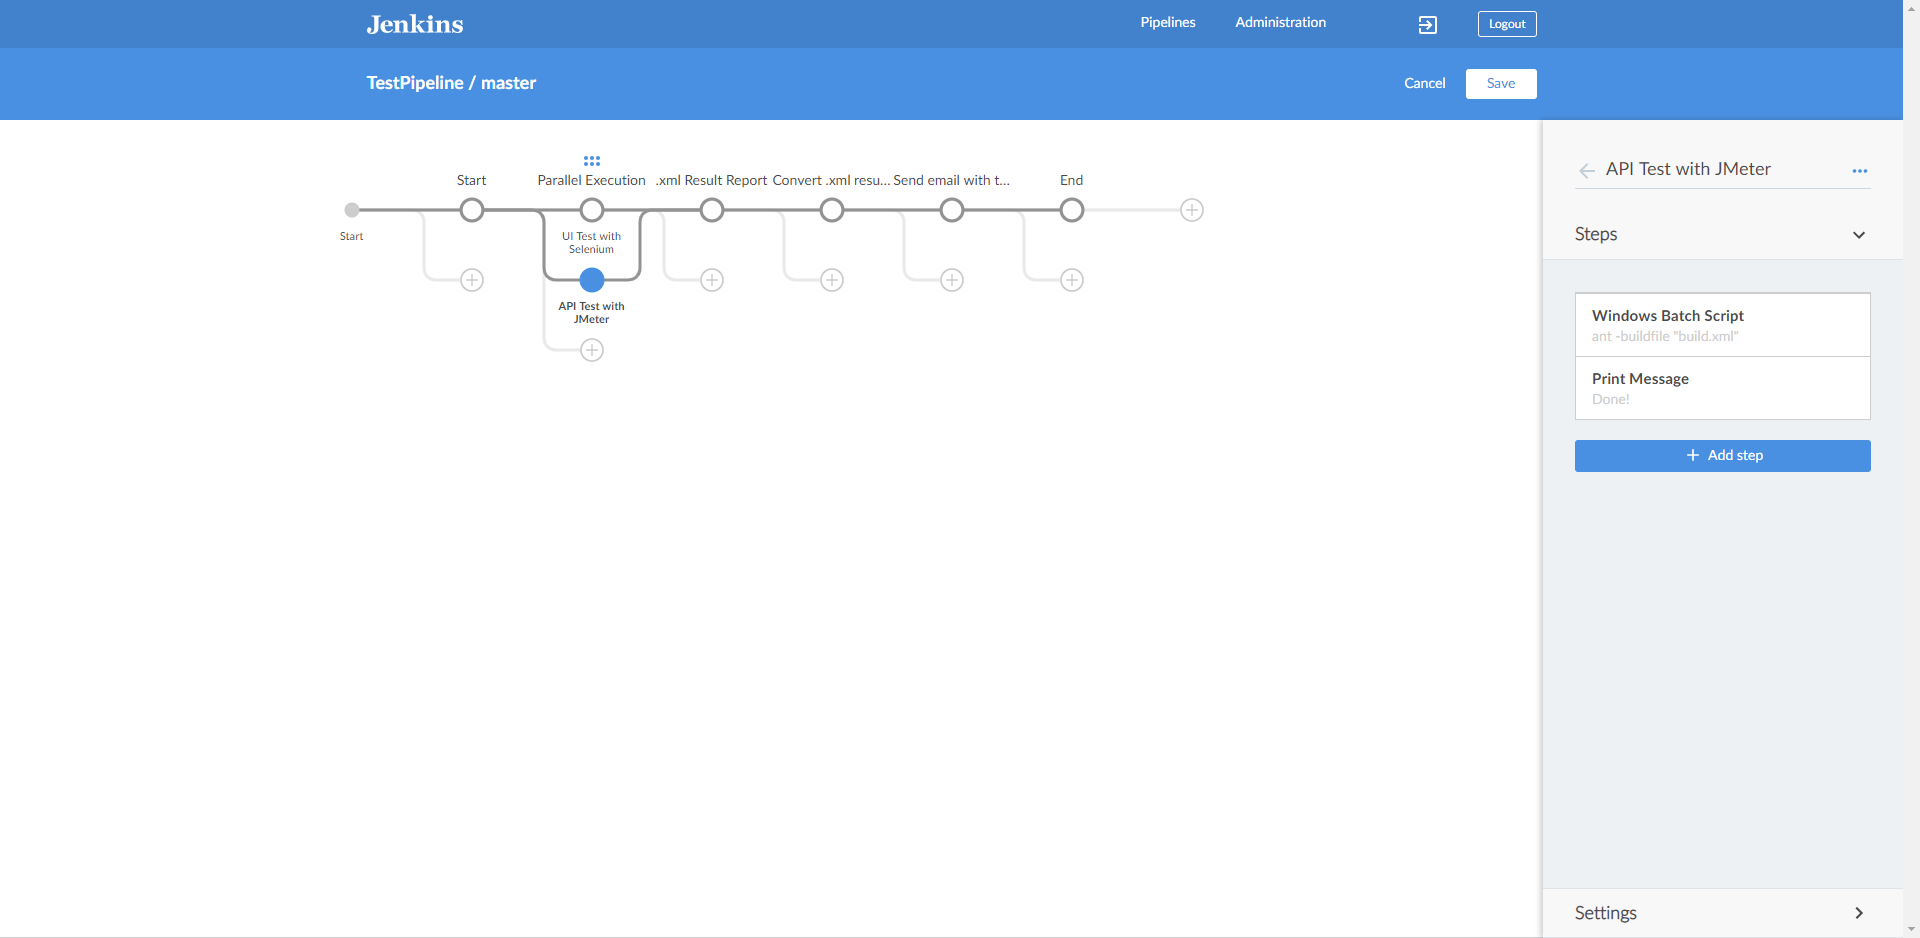
(Figure 10 – Second stage – task 2b)
In the third stage (Figure 11), there will be one step, Archive Junit – formatted test results, in which we get the generated .xml results from the execution of the Maven project with UI test scripts in Selenium.
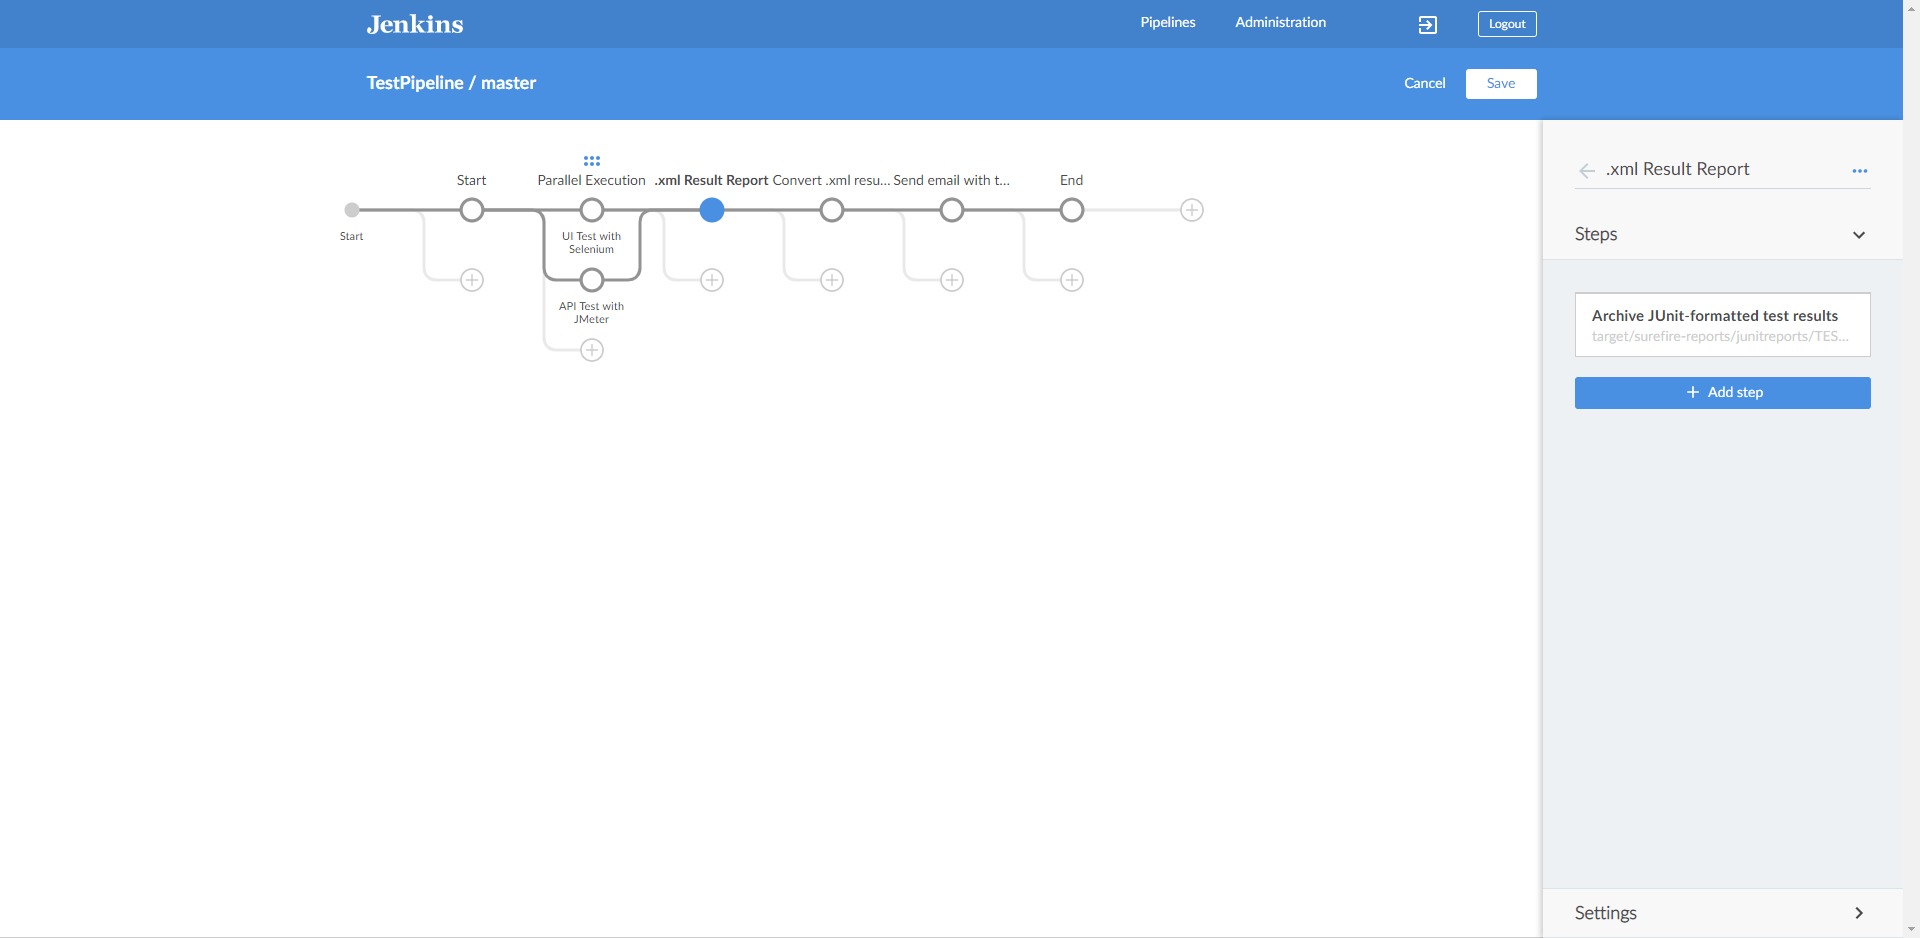
(Figure 11 – Third stage)
The fourth stage (Figure 12) will have Windows Batch Script, that will execute ANT script, which converts the previously generated .xml file in HTML format.
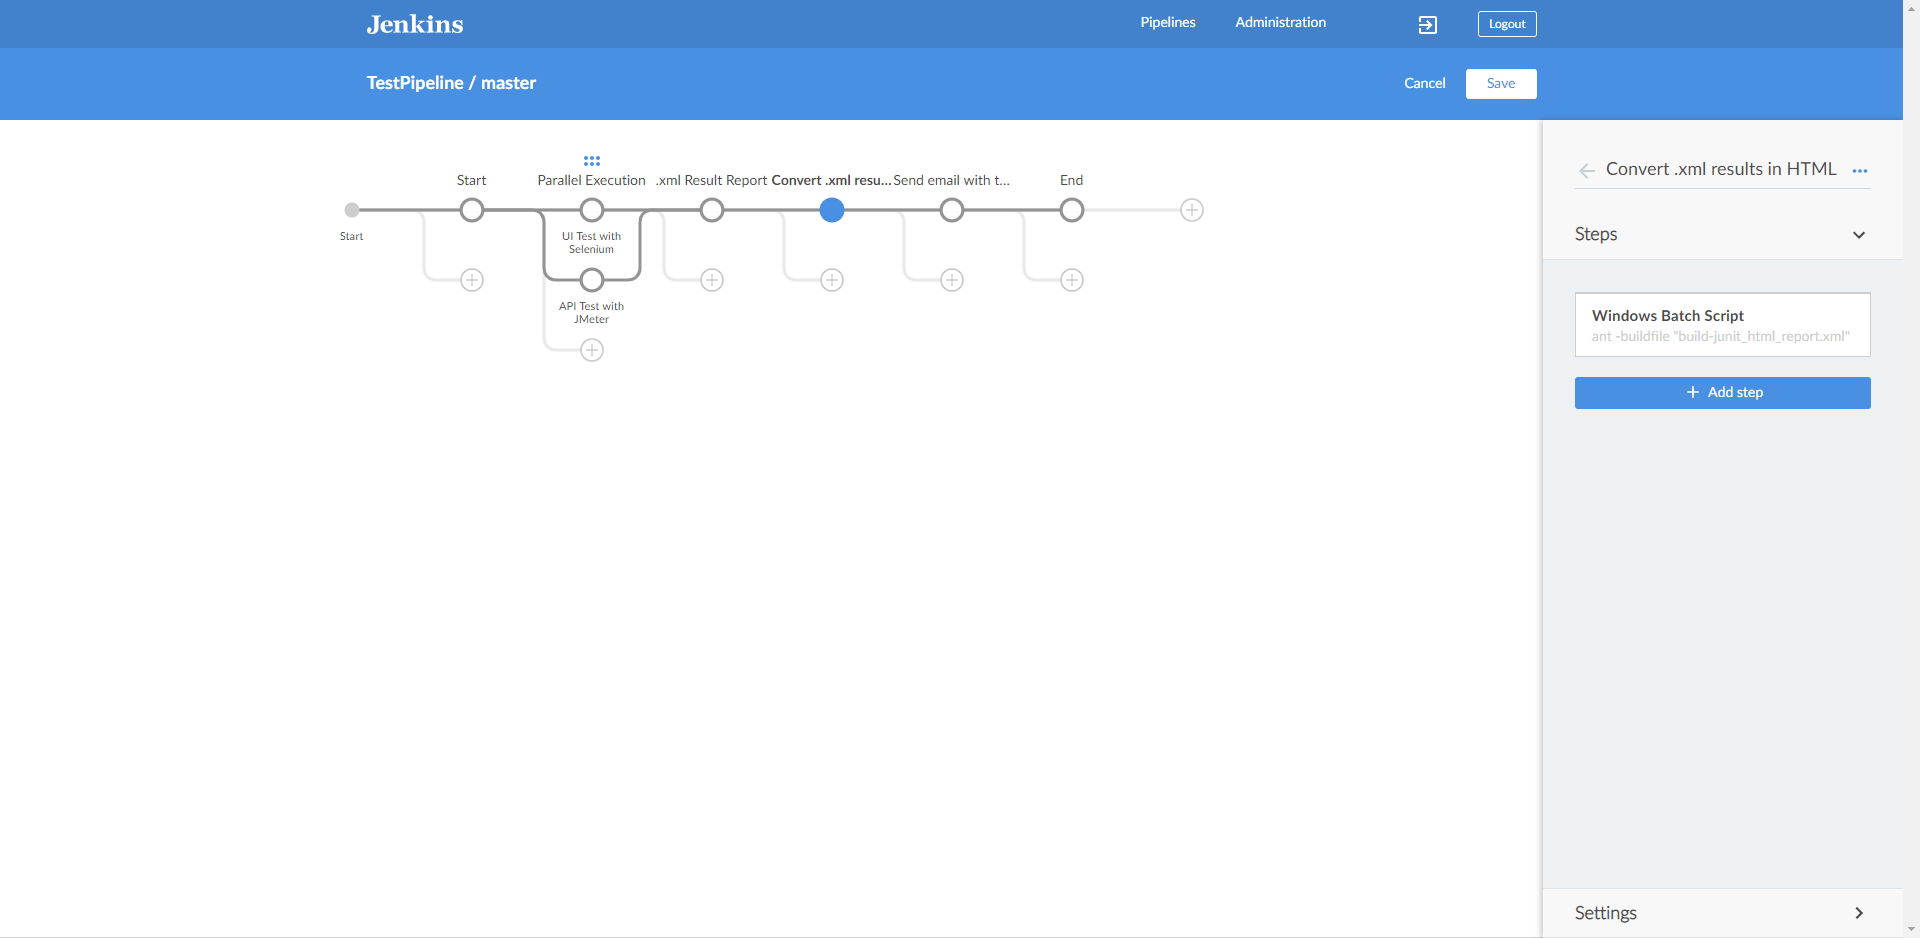
(Figure 12 – Fourth stage)
After the fourth stage, conversion of files is completed, follows the fifth stage (Figure 13) which will send email with the test result reports for both types of test executions. It is consisted of one step, Extended email, that will send email with test results from the Maven project test suite with Selenium and test results for the execution of JMeter API tests.
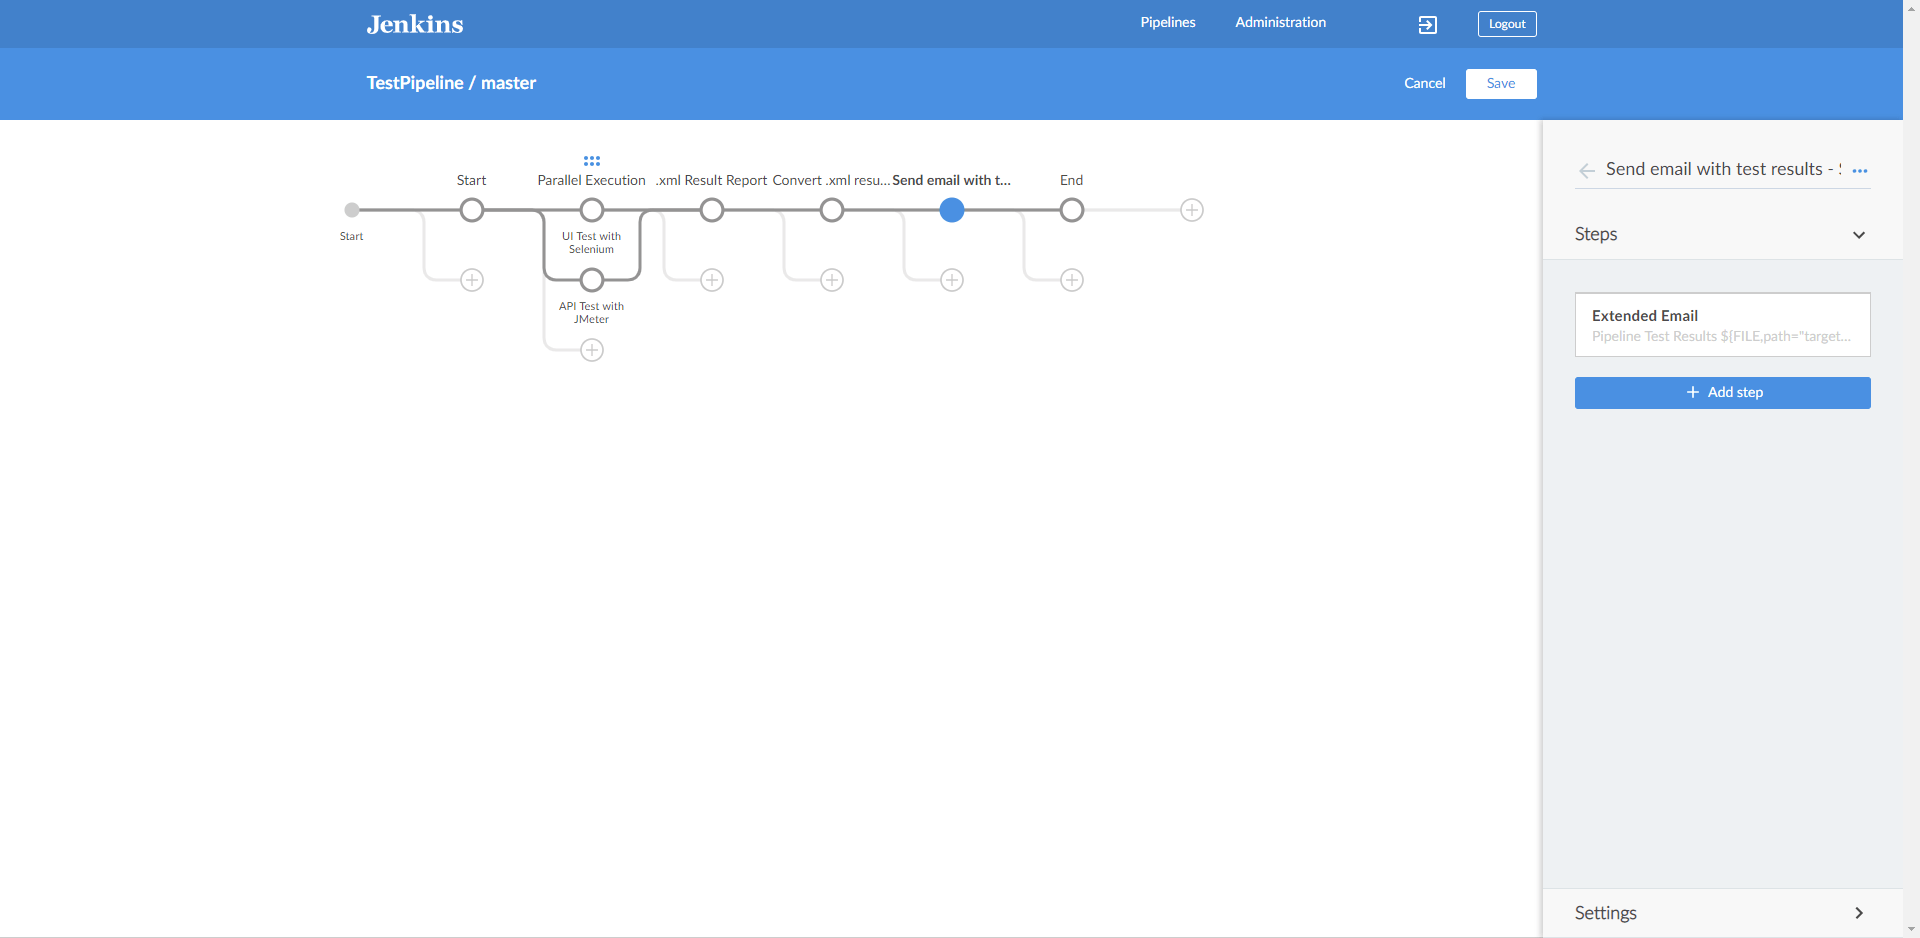
(Figure 13 – Fifth stage)
The last stage (Figure 14) for this Pipeline is End, and contains one step i.e. to print message that the Pipeline execution finished successfully.
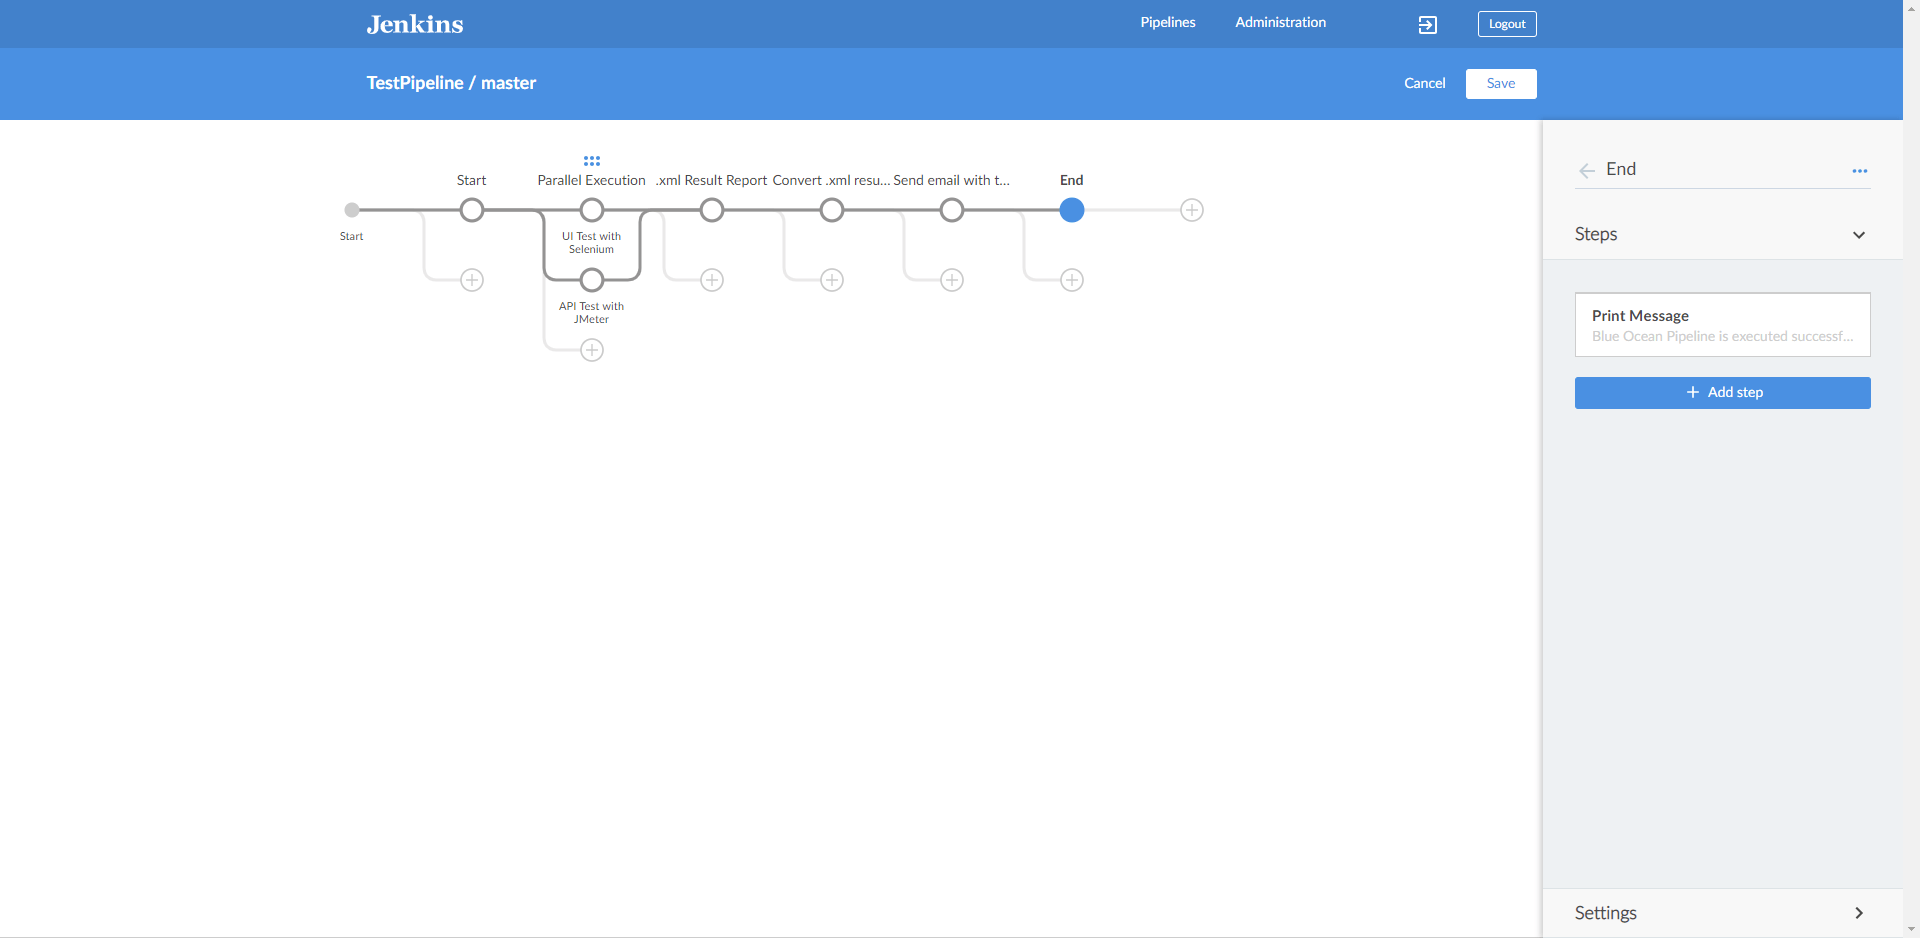
(Figure 14 – Sixth stage)
After adding the desired stages, in order to be run, changes to a Pipeline must be saved in source control. When Save button is clicked, the “Save Pipeline” dialog (Figure 15) controls saving of changes to source control.
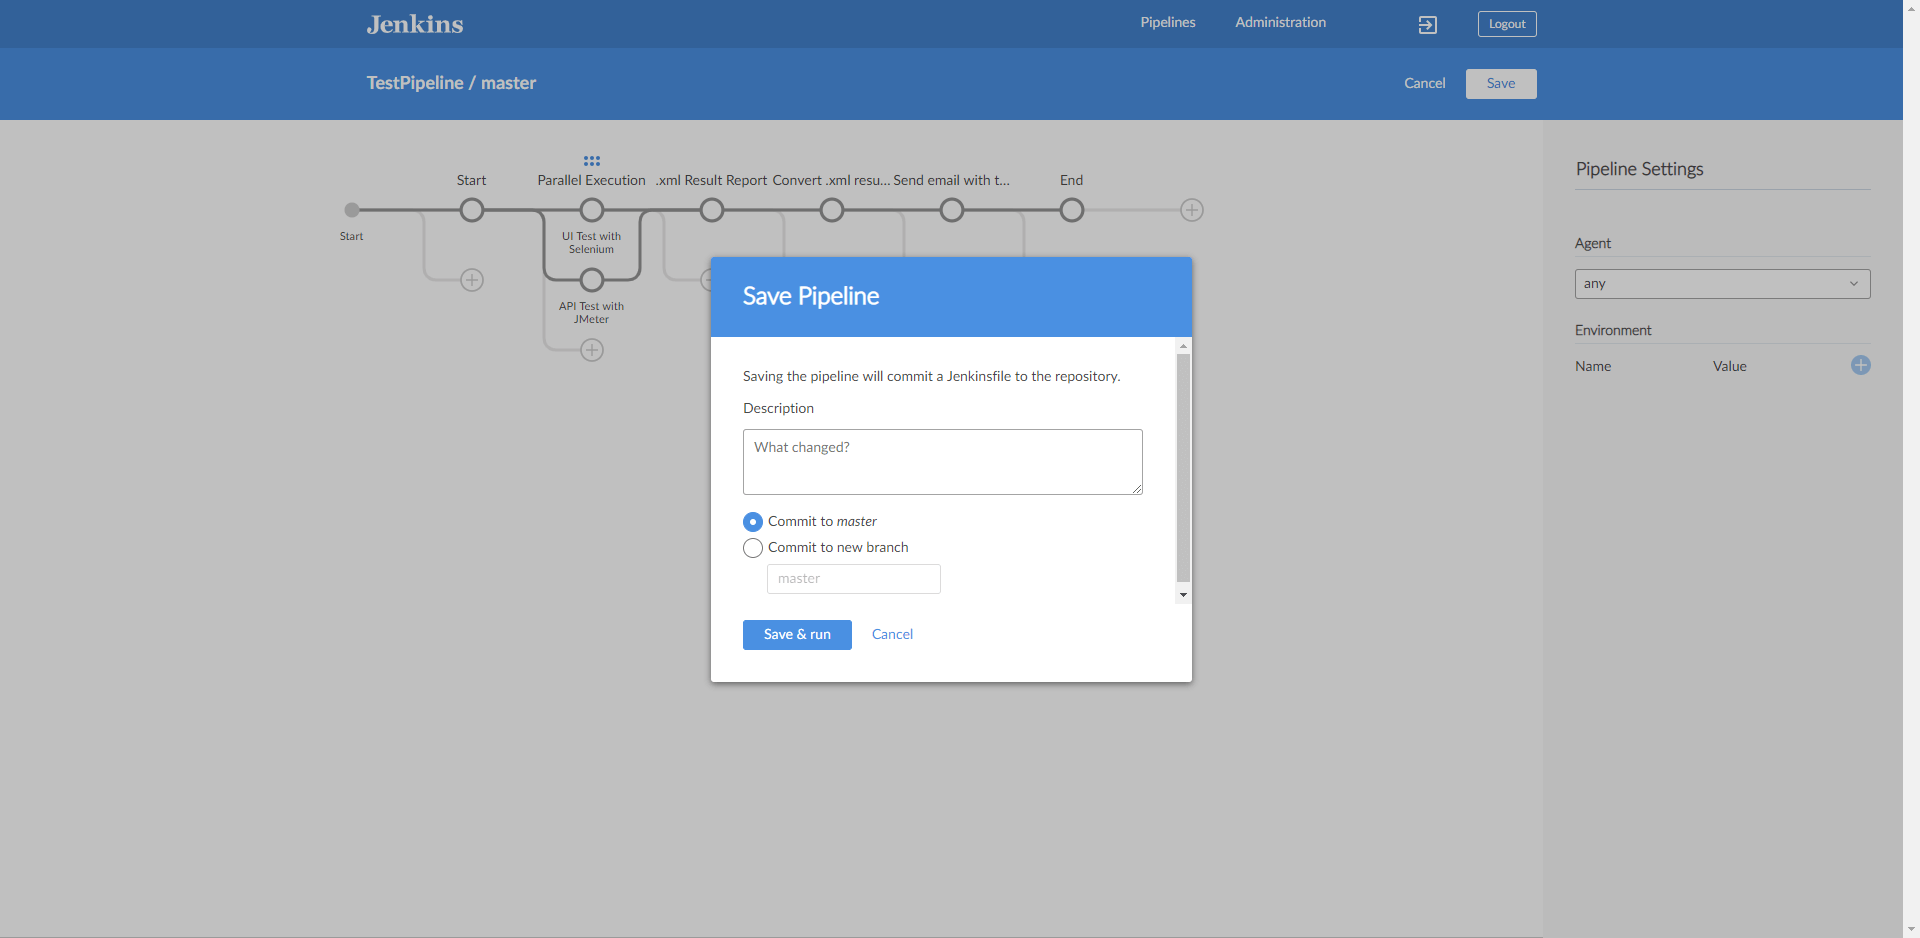
(Figure 15 – Save pipeline dialog)
A helpful description of the changes can be added or left blank. The dialog also supports saving changes to the same branch or entering a new branch name, for which it automatically creates a branch in the repository and saves it. Clicking on “Save & run” will save any changes to the Pipeline as a new commit, will start a new Pipeline Run based on those changes, and will navigate to the Activity Viewfor this pipeline. To see how the run proceeds, click on the running pipeline from the list. It shows each stage in progress and below there are shown the steps in those stages (Figure 16), and the console output for those steps.
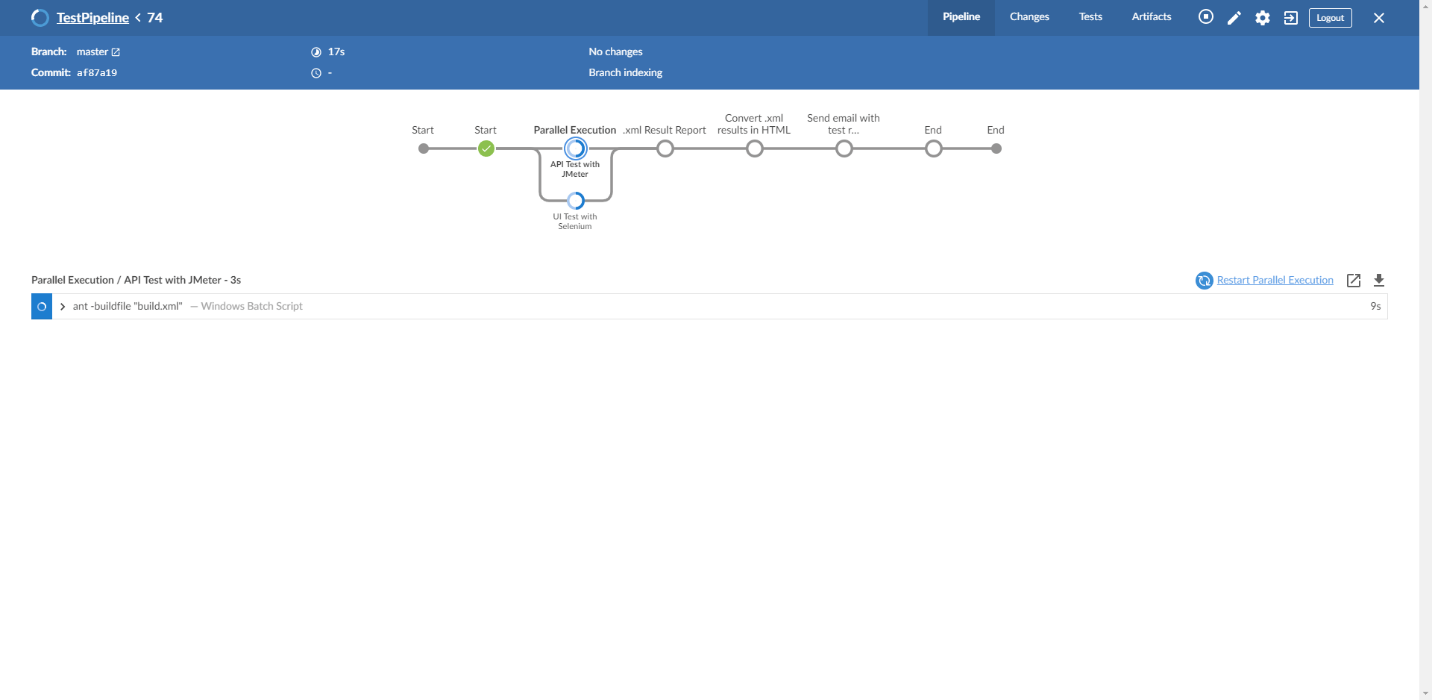
(Figure 16 – Stage in progress)
If you want to see the console output of the steps, while the Pipeline execution is in progress, you have to click on the arrow in front of the step (Figure 17).
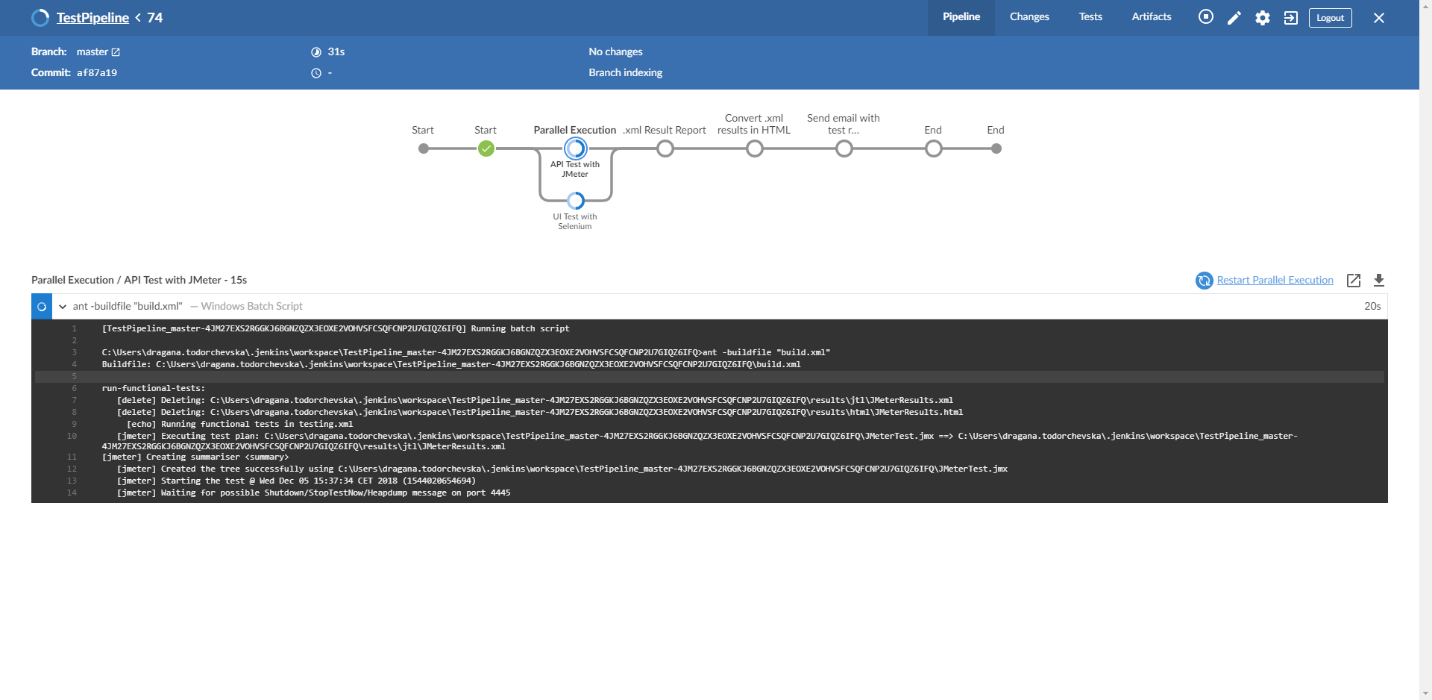
(Figure 17 – Console output while execution)
Console Outputs After the Run is Complete
After the run is finished, you can check the console outputs.
Stage 1 – Start (Figure18)
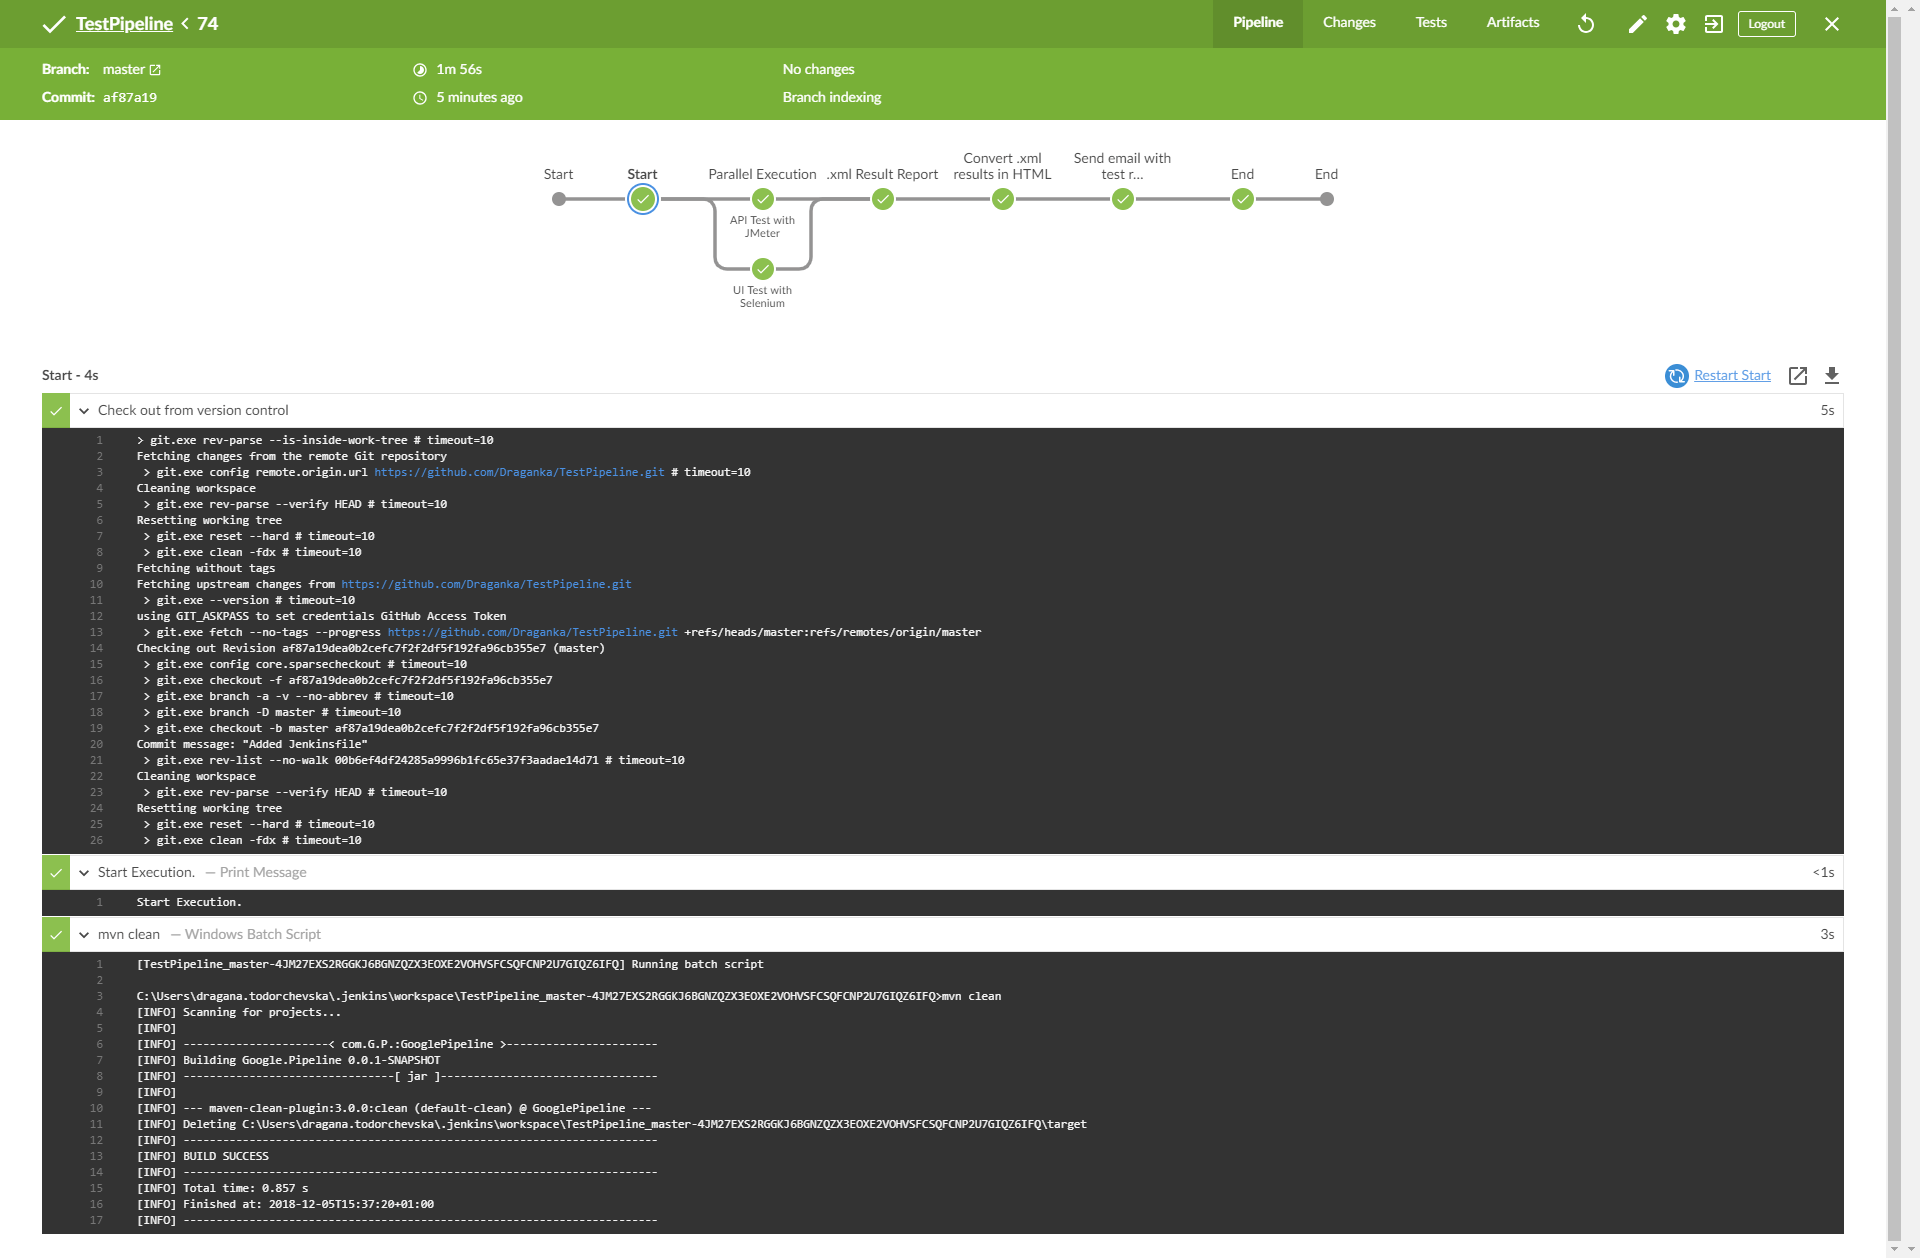
(Figure 18 – Console Output Stage 1)
Stage 2, task b –API Test with JMeter (Figure 19)
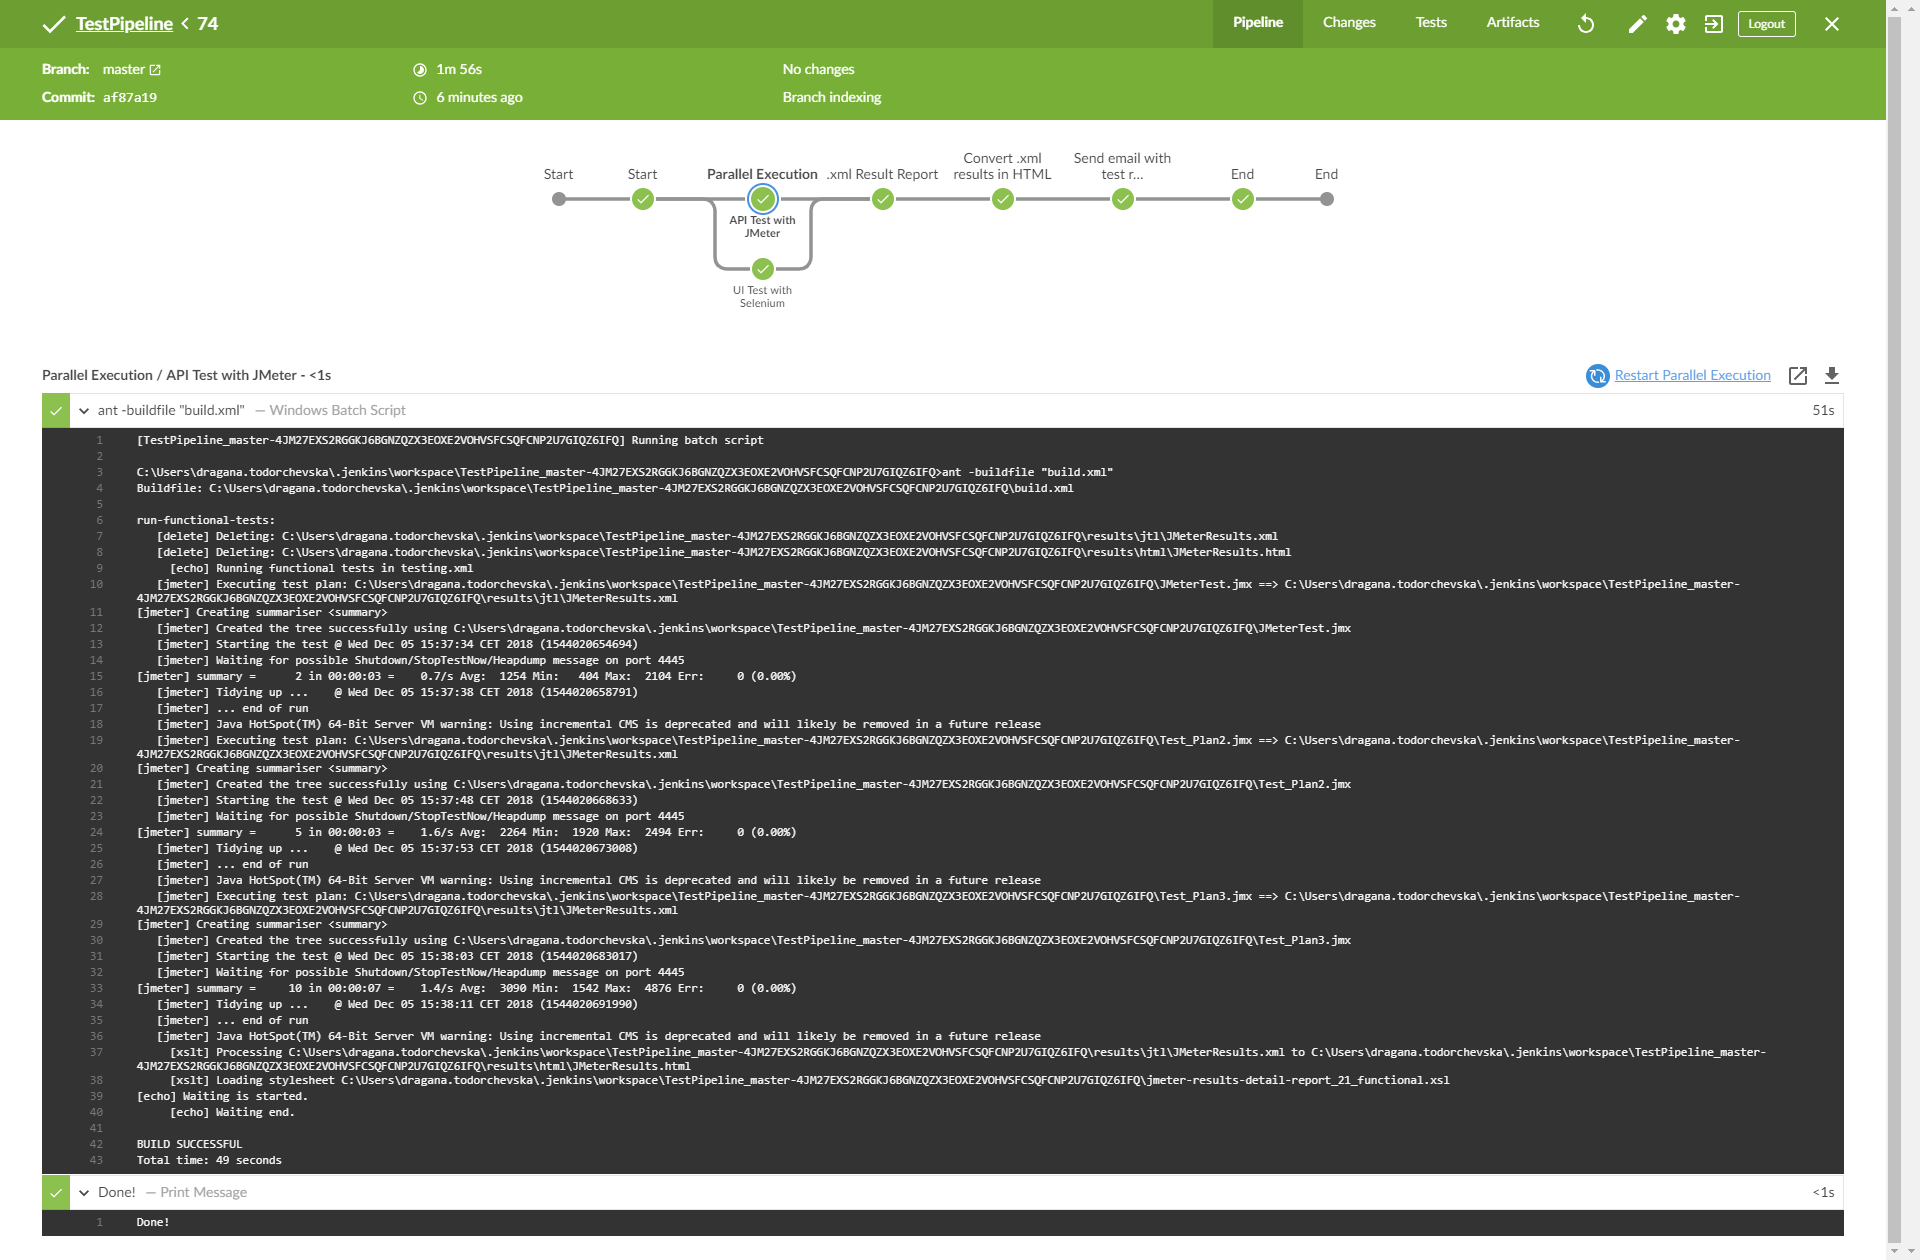
(Figure 19 – Console Output Stage 2 – task b)
Stage 2, task a –UI Test with Selenium (Figure 20)
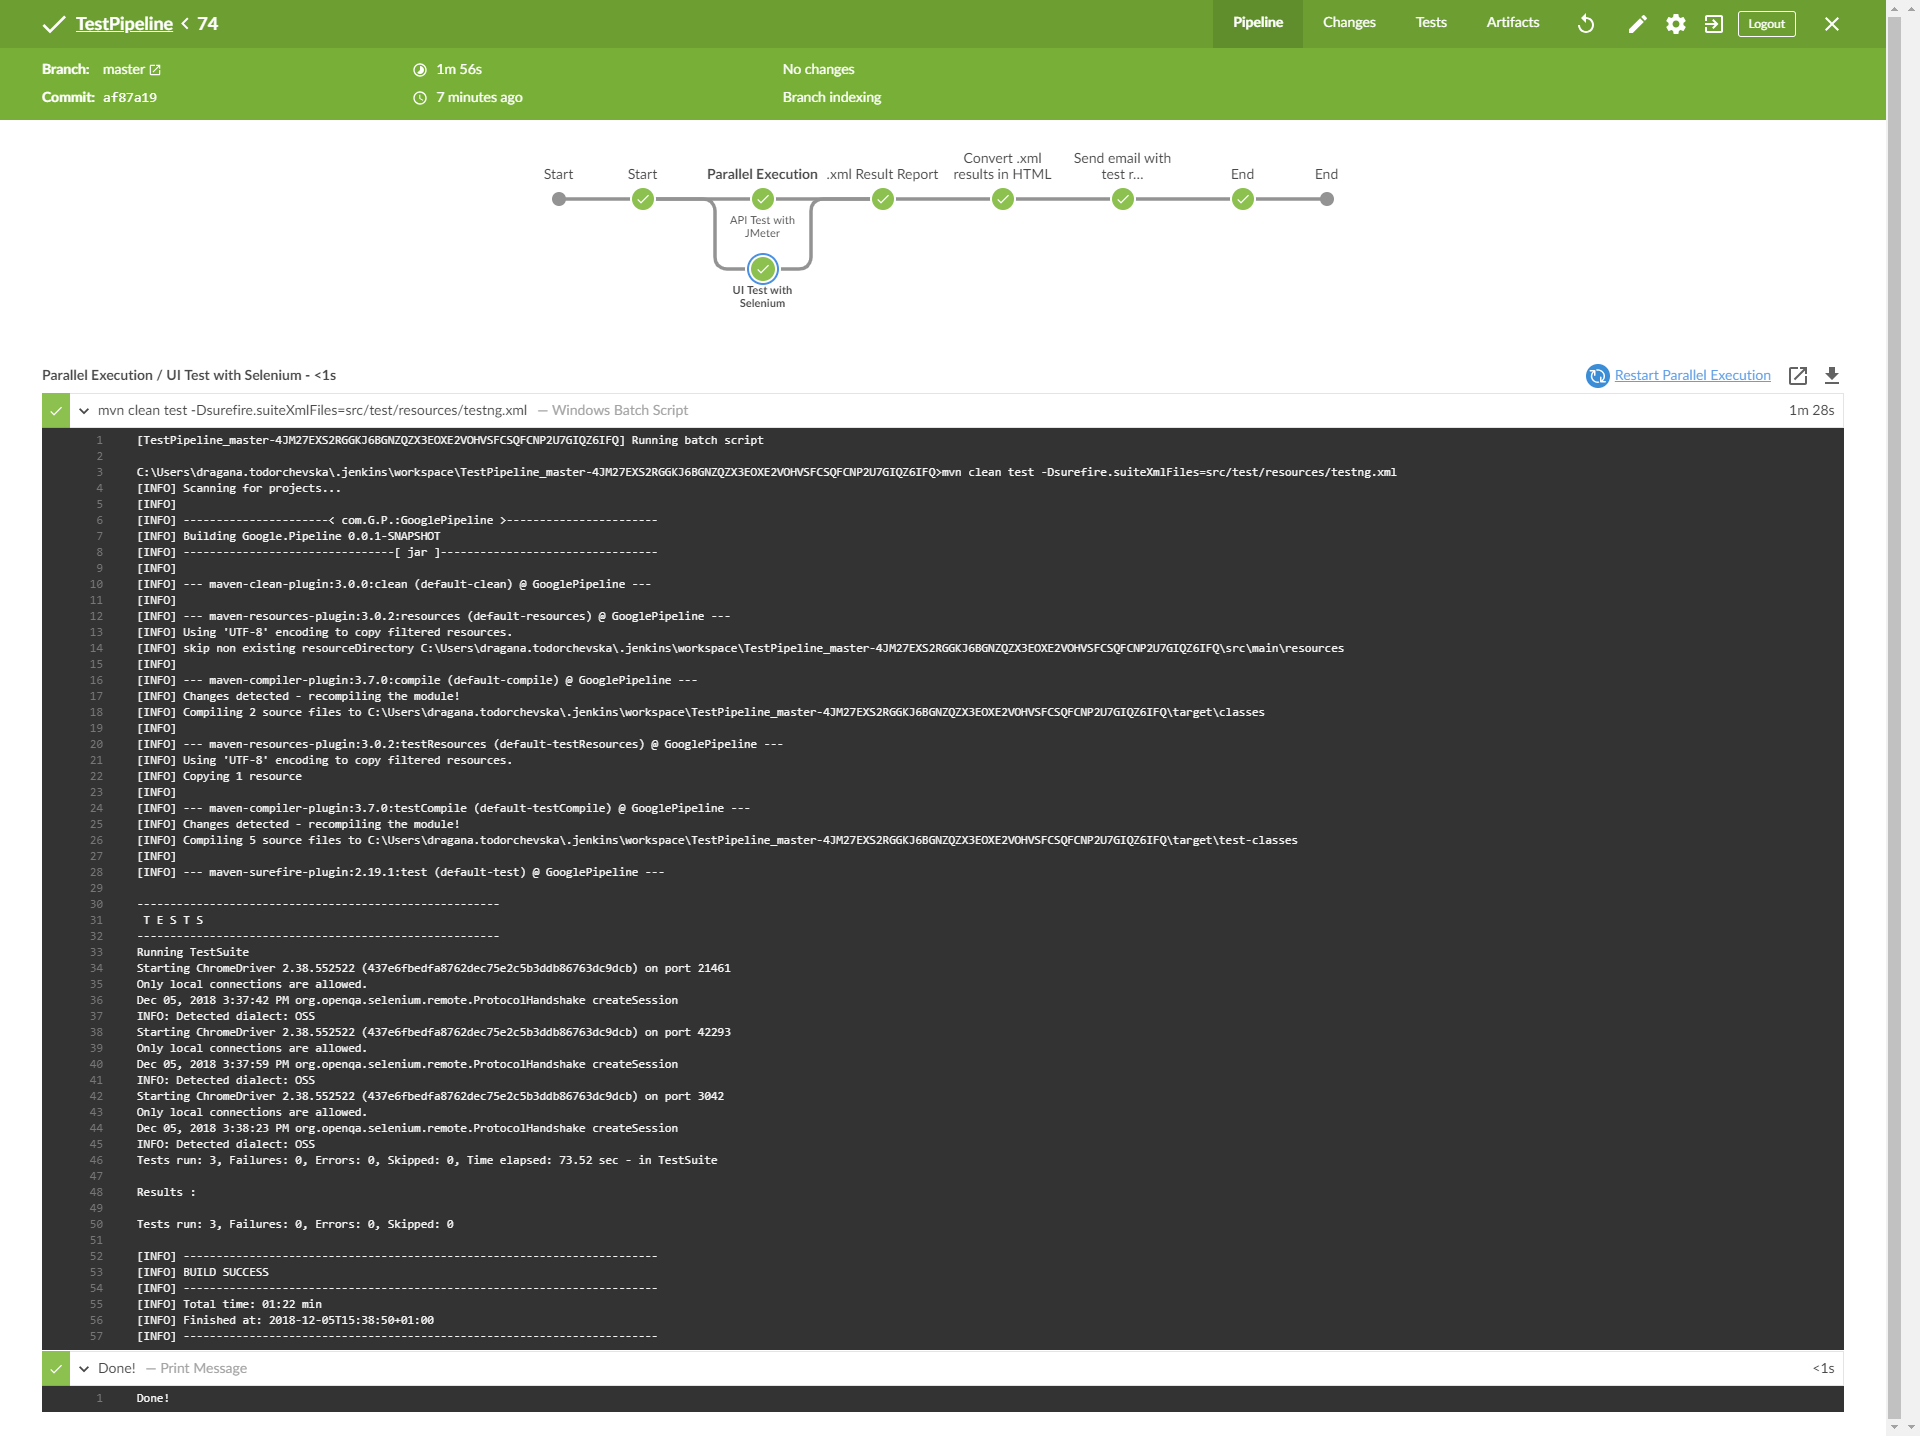
(Figure 20 – Console Output Stage 2 – task a)
Stage 3 – .xml Result Report (Figure 21)
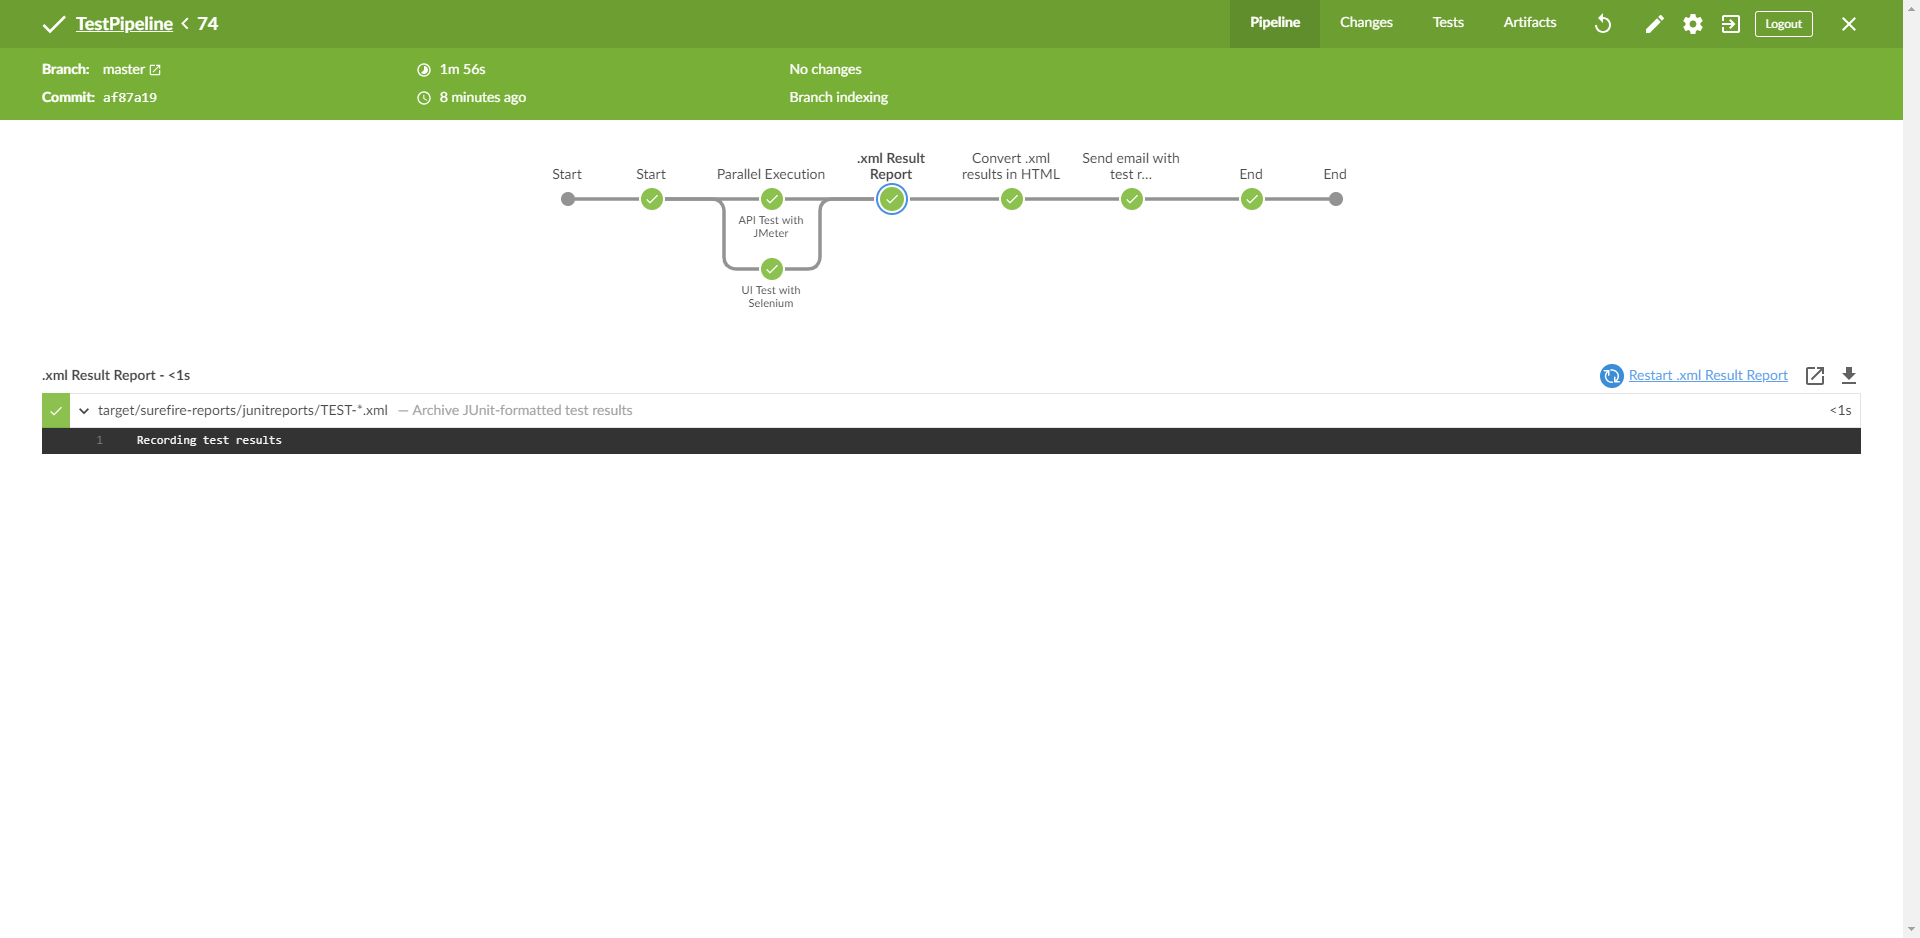
(Figure 21 – Console Output Stage 3)
Stage 4 – Convert .xml results in HTML (Figure 22)
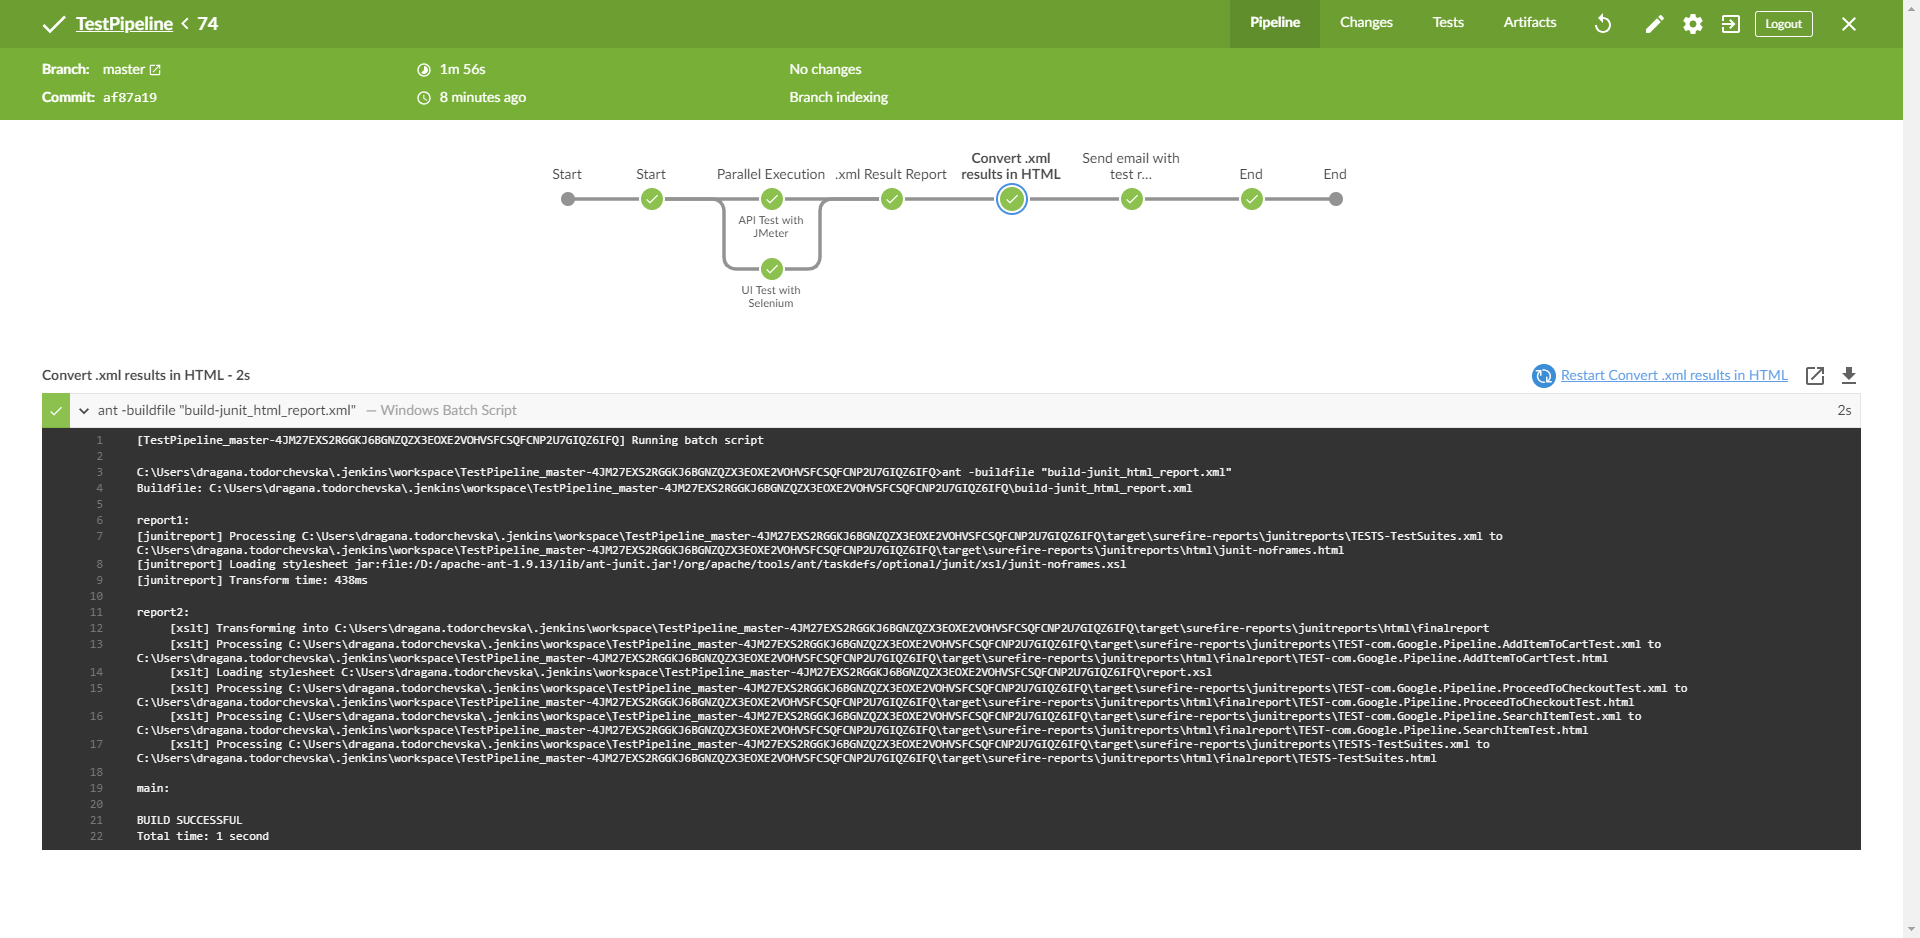
(Figure 22 – Console Output Stage 4)
Stage 5 – send Email with test results for both tests (Figure 23)
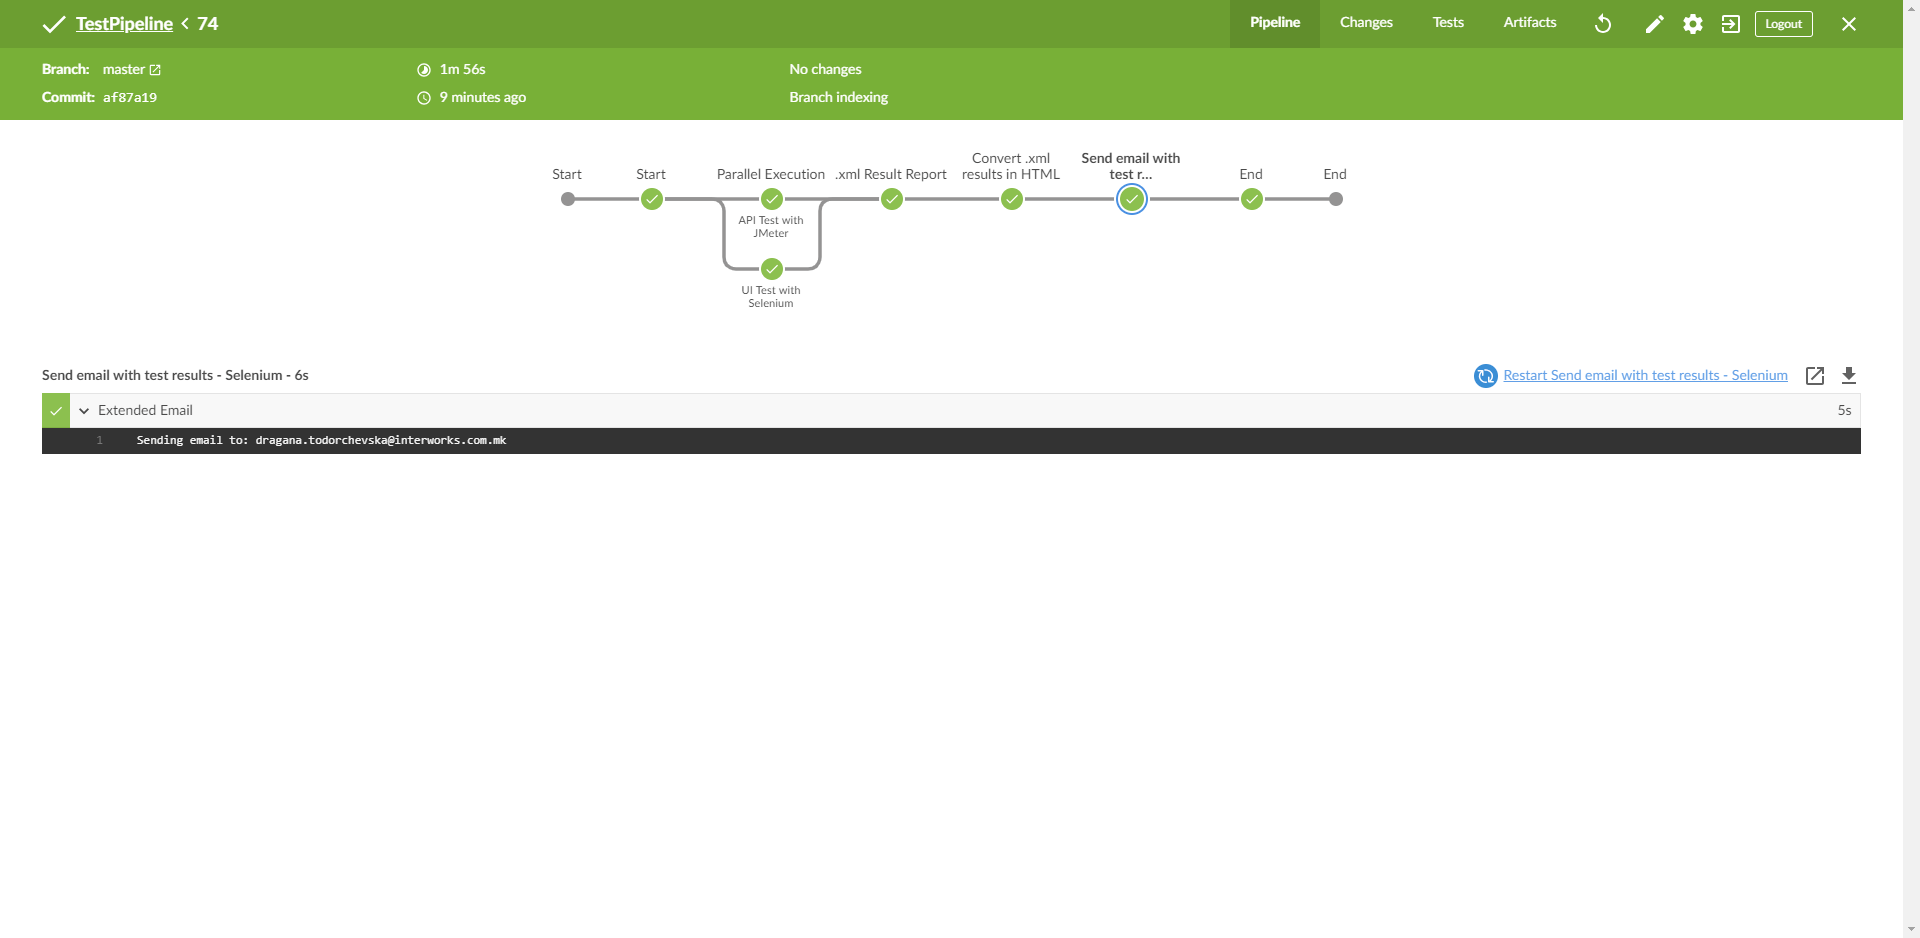
(Figure 23 – Console Output Stage 5)
Pipeline Test Results on E-mail (Figure 24 and 25)
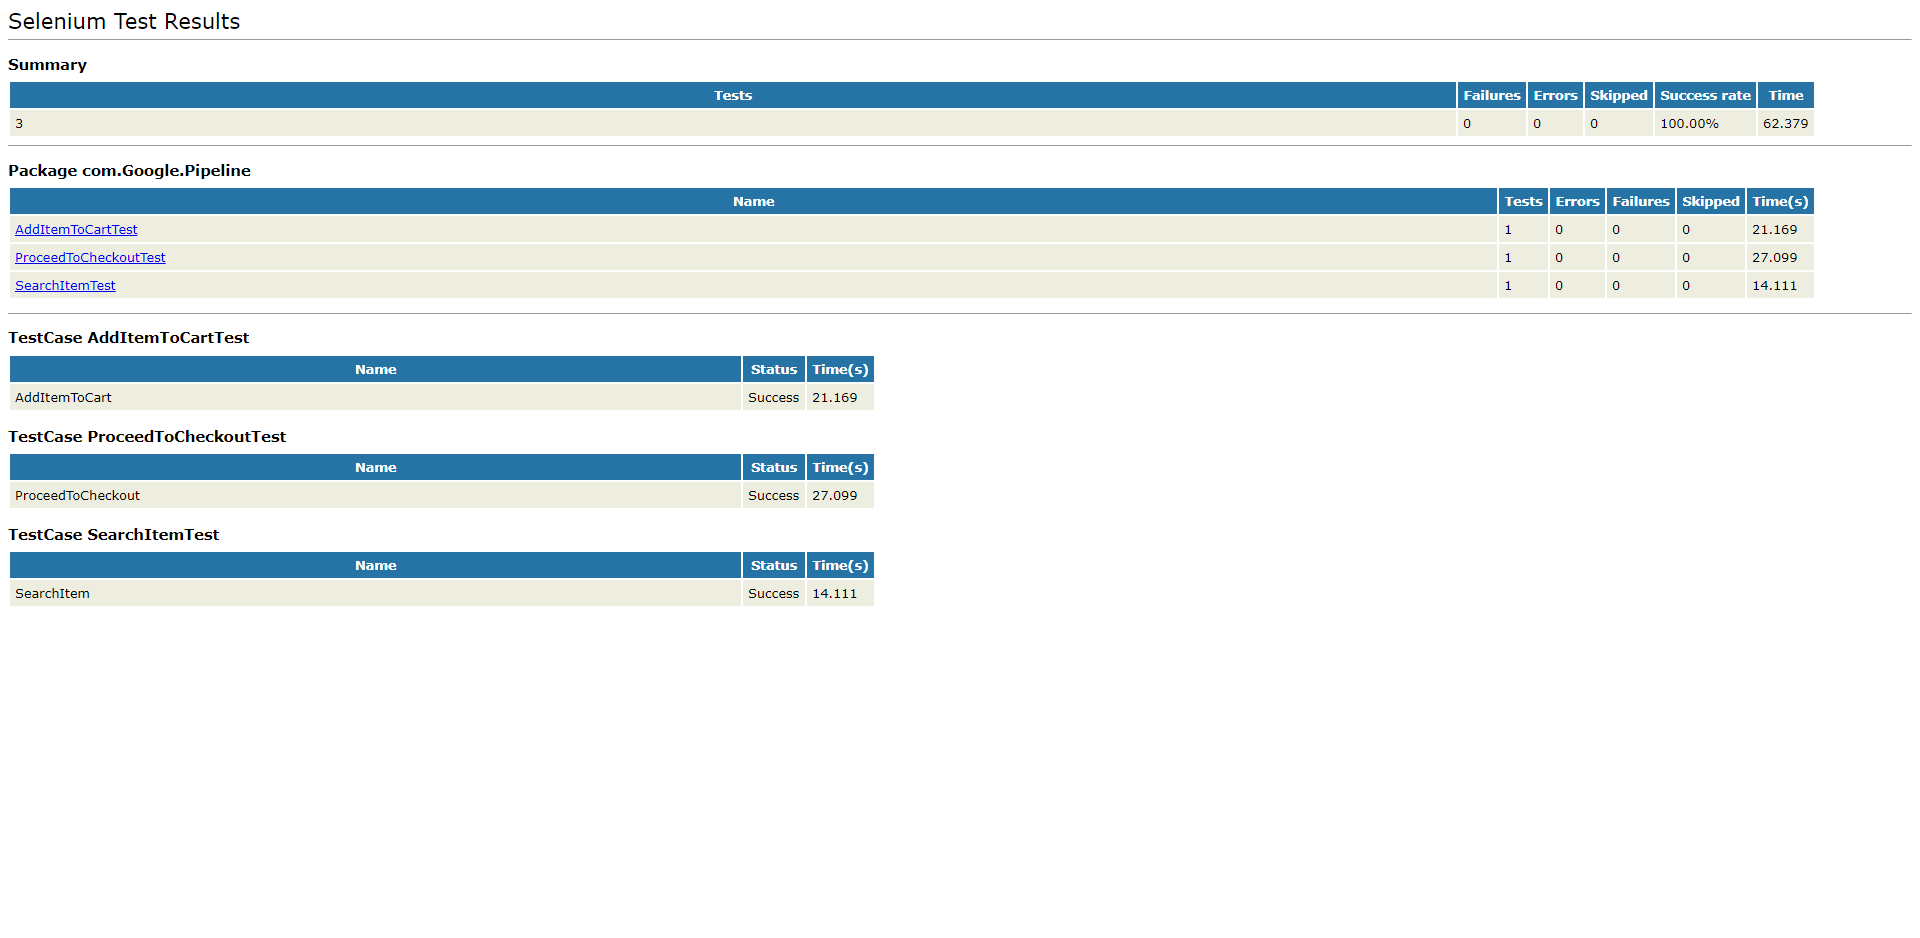
(Figure 24 – Selenium Test Results on E-mail)
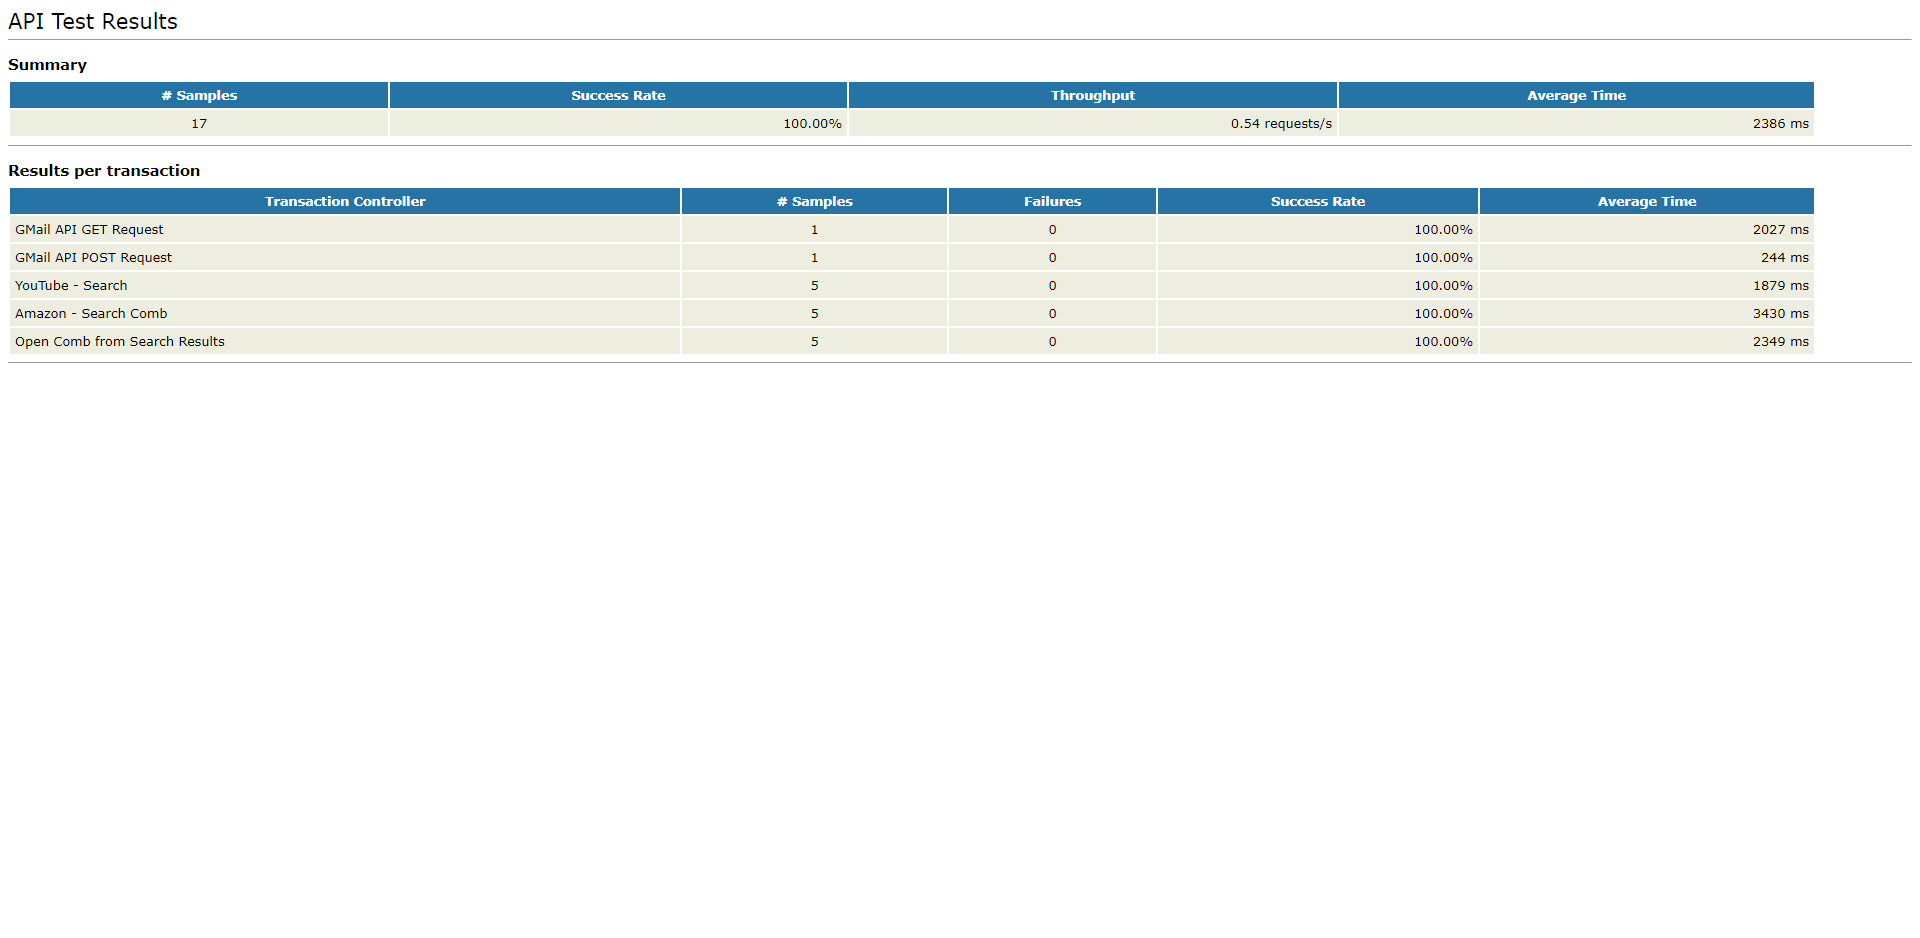

(Figure 25 – API Test Results on E-mail)
Stage 6 – End (Figure 26)
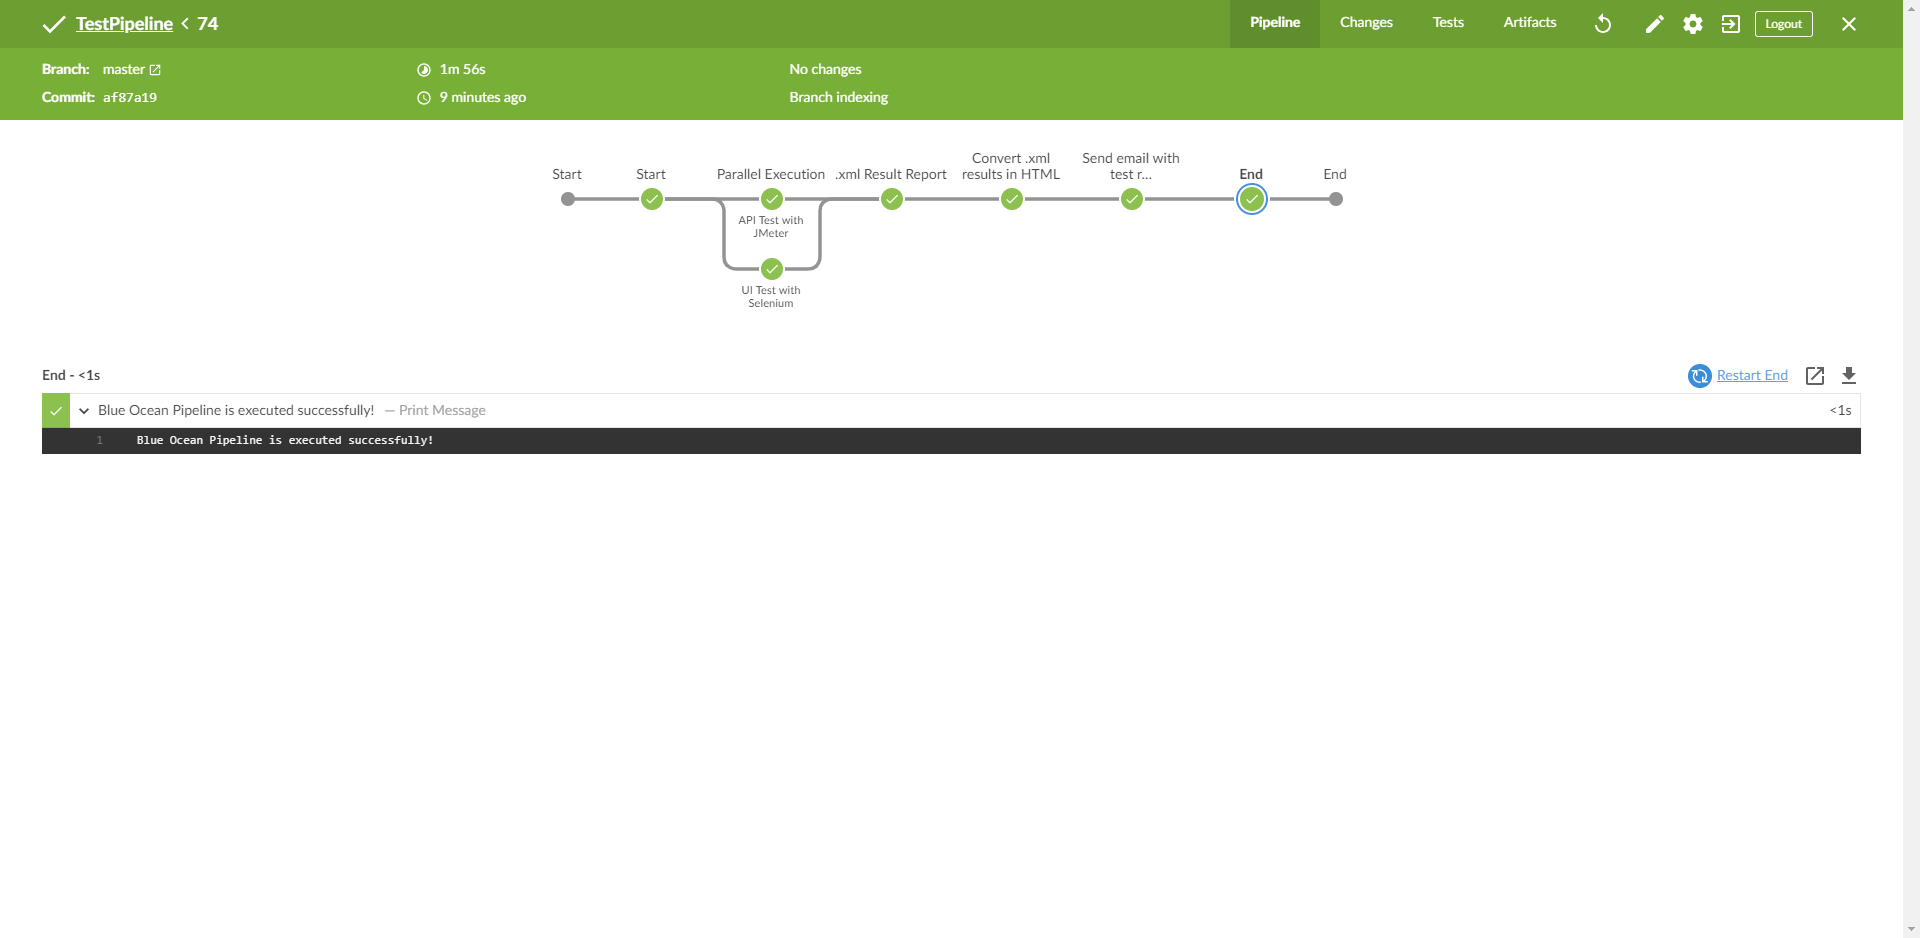
(Figure 26 – Console Output Stage 6)
If there is some error in one of the steps, and if particular step fails during the run (Figure 27), this tab will automatically show the console log from the failed step.
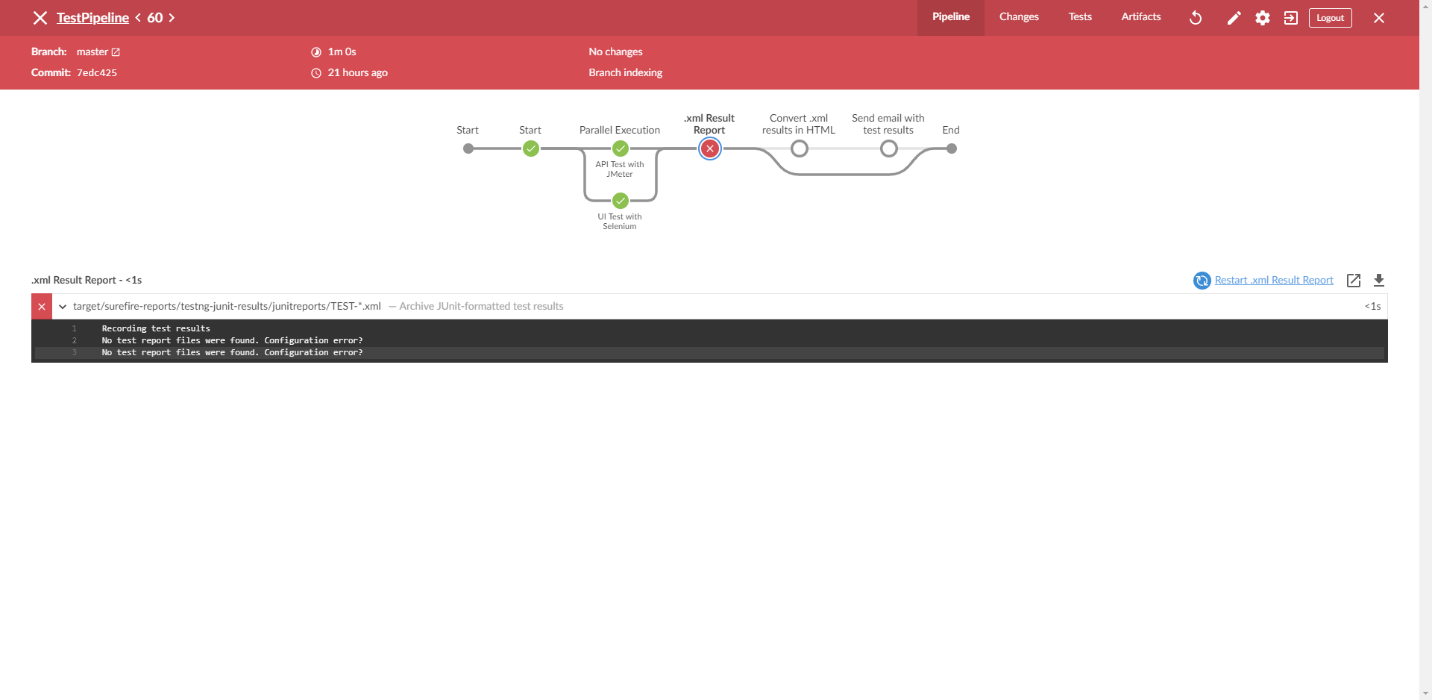
(Figure 27 – Failed step)