

Reports give us a cumulative overview of our activities and provide us with insights enabling us to compare and further improve our activities. Regardless of the type of activity and the software that we use to get those reports, sometimes we struggle with getting the exact reports that we need due to the software not having enough features that satisfy our needs.
ServiceNow, which we all know is a cloud computing platform that allows developers and enterprises to work the way they want offers building custom reports. But, how can we create a custom report with a dynamic date? In the following lines, we will explain step by step how to do that. The tricky part here is that there is no option to put a dynamic date value from a field, i.e. the date entered in the condition it must be static.
Reporting in ServiceNow enables you to create and distribute reports that show the current state of instance data, such as how many open incidents of each priority there are. Reporting functionality is available by default for all tables, except for system tables. (Source: ServiceNow Reporting)
Report Types
We can generate the following types of reports, organized by category:
- Bar reports enable you to compare scores across data dimensions.
- Pie and Donut reports visualize the relationship between the parts and the whole of a data set using shapes such as pies.
- Time Series reports visualize data over time. In addition to data from within your instances and imported data sources, you can also use MetricBase data in time series reports. For more information, see MetricBase application.
- Multidimensional reports visualize data across dimensions in a single table or graph.
- Scores visualize single data points either across ranges or as a single value.
- Statistical reports visualize data with statistical values such as medians and means.
Other reports include calendars, maps, and lists. (Source: ServiceNow)
Building the report
Let’s start by choosing the type of report.
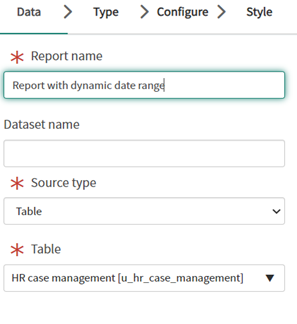
First, in the Data section:
- We need to enter a report name
- Choose a Source type
- Choose Table
In the Type section, we need to choose the type of report. In our case, we will choose the type of Bar.
In the Configure section:
- We need to choose a field in which the report values would be grouped.
- We will leave the empty Stack for now.
- Also, Aggregation is important for the report configuration, and in this case, we will choose the Count option.
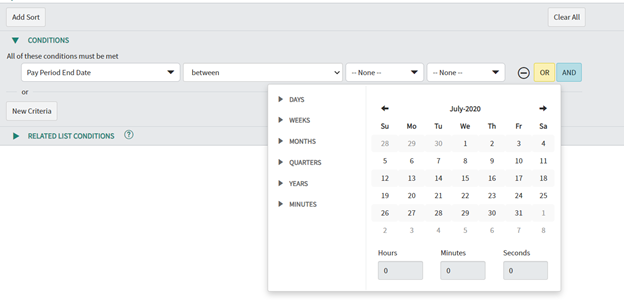
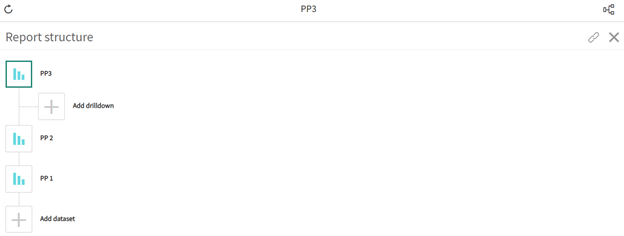
Next, we will make 3 different drilldowns based on a different dynamic date value.
The filter in the drill down is based on a custom field.
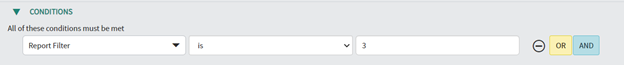
This custom field is created just for filter purposes. The field is populated based on an after-insert/update Business Rule. The value in this field is based on a date field which is part of this table also.
The business rule code
Let’s first create an object from the table we want to query.
var gr = new GlideRecord('table');Next, we need to build the query. Also, we need to exclude the inactive records for optimization.
    gr.addQuery('active', 'true'); // Optimization
	gr.orderByDesc('u_date_field');
	gr.query();
Also, the values in the query are ordered by the date field. Before running the query, we will make another optimization where we will calculate only the records that are in the last two months.
var date = new Date();
var year = date.getFullYear();
var month = '0' + (date.getMonth() - 1); // date offset, array zero based
var day = '0' + date.getDate();
var days = day.substr(day.length-2, 2);
var months = month.substr(month.length-2, 2);
var actualDate = year + '-' + months + '-' + days;
We are ready to run the query. Here we must convert the values to string so we can use them later in the function.
while(gr.next()){
if(gr.u_pay_period_end_date > actualDate){
answer.push(gr.u_pay_period_end_date.toString());
		}
		}
We now have all the dates from the records from the last two months, but a lot of records will have the same dates, so for that reason, we will create a function that will remove the duplicate values.
	var unique = {};
		answer.forEach(function(i) {
			if(!unique[i]) {
				unique[i] = true;
			}
		});
Next, we will store the first 4 values in variables.
		var firstKey = Object.keys(unique)[0].toString();
		var secondKey = Object.keys(unique)[1].toString();
		var thirdKey = Object.keys(unique)[2].toString();
		var forthKey = Object.keys(unique)[3].toString();
Once we have stored the values in a variable we can make the logic to fill the field which we will use in the report filter.
Let’s create an object from the table we want to query. Also, in this query, we will make a huge optimization of the procedure.
var fr = new GlideRecord('table');
fr.addQuery('active', 'true'); // Optimization
fr.addQuery('u_date_field', '>=', forthKey); // Optimization
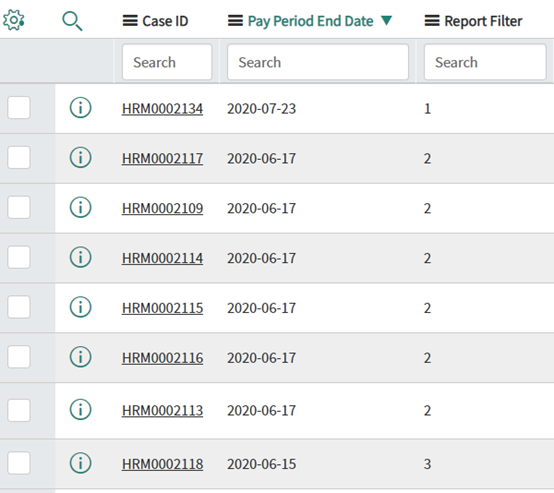
fr.query();After running the query, the report filter field is filled based on the date field which is also part of the record.
		while(fr.next()){
			if(fr.u_date_field == firstKey && fr.u_report_filter !=1){
				fr.u_report_filter = 1;
				fr.update();
			}
			if(fr.u_date_field == secondKey && fr.u_report_filter !=2){
				fr.u_report_filter = 2;
				fr.update();
			}
			if(fr.u_date_field == thirdKey && fr.u_report_filter !=3){
				fr.u_report_filter = 3;
				fr.update();
			}
Last, we need to check if there are records that have a date that is not one of the last three dates, and previously it was, so we will remove the value from the report filter field.
		if(fr.u_date_field < thirdKey && fr. u_date_field > forthKey && fr.u_report_filter !=""){
				fr.u_report_filter = "";
				fr.update();
			}
		}
Conclusion
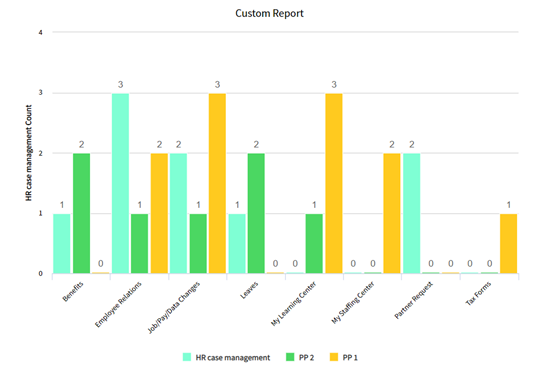
Let’s summarize, ServiceNow lets us manipulate and configure things to fulfill our needs. There was no option to make this functionality possible without providing a custom coding solution. Also, while coding we must think about process optimization. The table will have a lot of records which we should exclude to make this faster and more user-friendly. So, after every newly inserted record or updated existing one, the Business Rule will run and will fill the Report Filter field which we are using to show the reports. In the end, the result is this.
Benefits
- Advanced Report
- Users can pull crucial data from the table
- Improved visualization
- The time of the agent who is working with statistics is dramatically reduced