
Introduction
In addition to the previous blog post “Monitoring Tool in SnapLogic” in this one we will present the power of SnapLogic as an integration tool and usability and flexibility of combining SnapLogic with other technologies and frameworks. Also, we offer moreinte sophisticated way for monitoring pipelines without even logging on the SnapLogic platform. You will be able to monitor every single pipeline in your own project by using one simple web application.
Process Monitor web application
For the purpose of this project we have used SnapLogic, ASP.NET MVC 5 framework, Bootstrap 3.3.7.
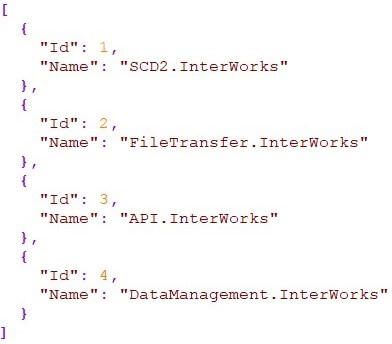
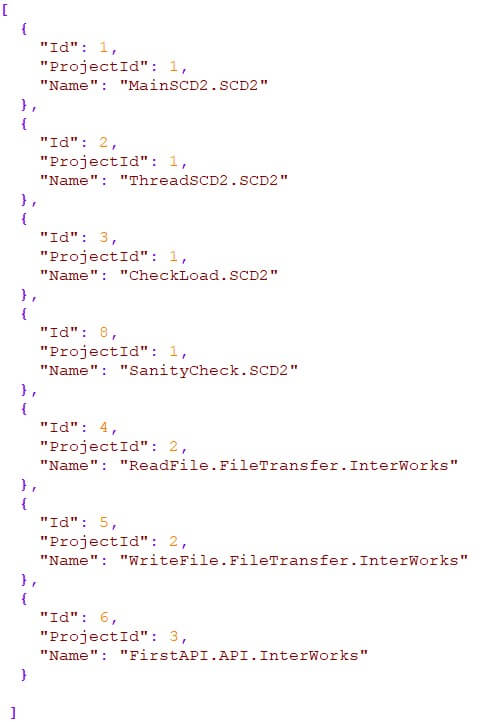
Big companies have a lot of SnapLogic processes (pipelines) and usually they are separated in different projects. Starting from that point, division by process and project comes naturally, so following that pattern, we have created two files, one for our projects and one for our processes. Those two JSON files will be our source point and we can update them in order to have full control on the pipelines that should be monitored. That is just one possible solution on how the source data can be organized but you can always use databases, APIs or other endpoints that will keep your source data.
Once the source files were ready, the focus was put on building web app that will allow the employees or management team to have a clear image on the state of their SnapLogic processes. The aim of this web app is to get all of the information only by populating one simple form. As you can see in the figure 3, you can choose your desired project, process and enter time frame of the execution. Also, you can choose if you want to receive notification by email.
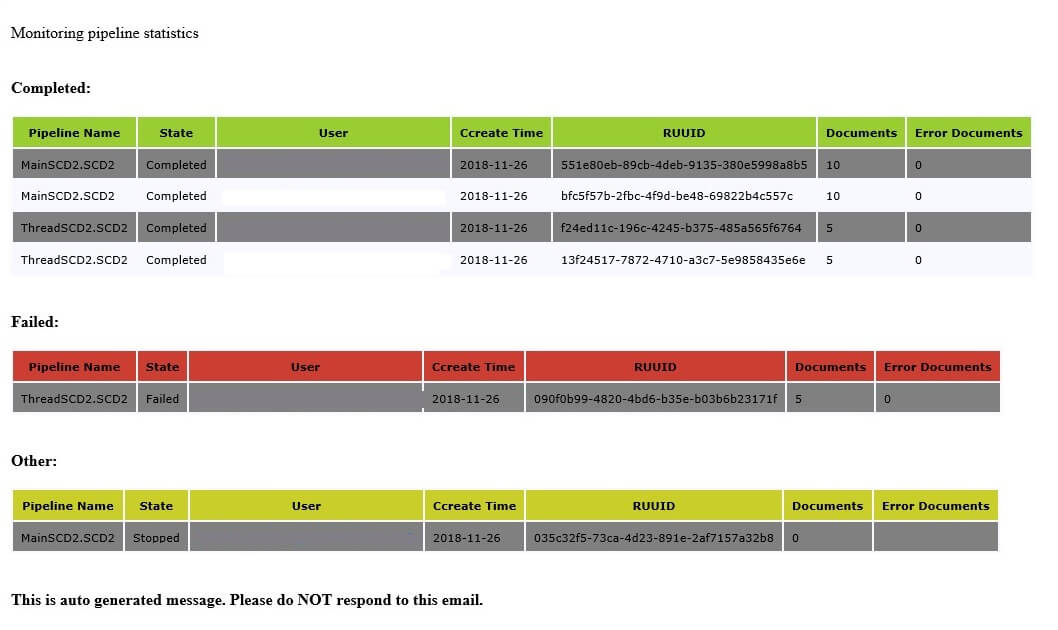
If you have Send the output by Email option selected and the recipient list correctly populated, you will receive an email with more information about the monitored processes.
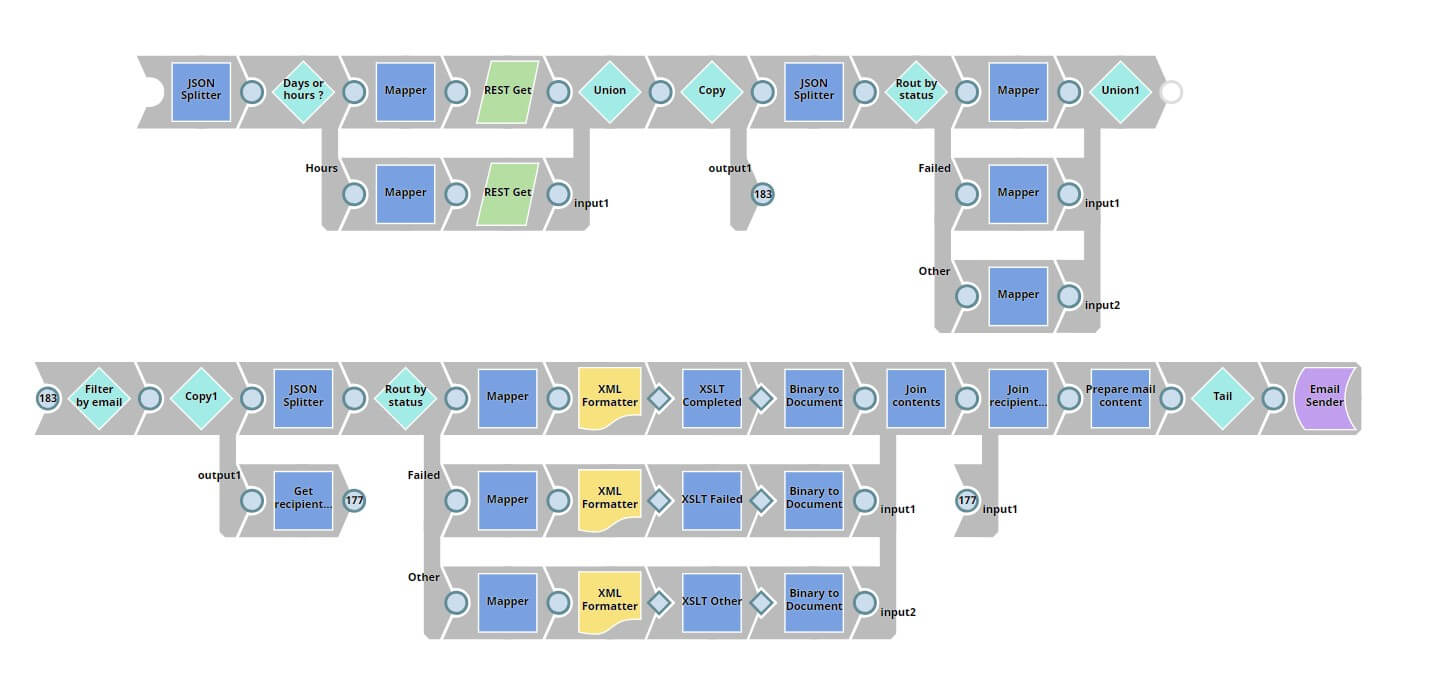
In this case, the following SnapLogic pipeline is exposed as an API that is waiting for some input JSON and will result with output JSON data. You can also notice that email sending is part of the SnapLogic process because of the simplicity and the fact that you can reuse your already existing SMTP account created in SnapLogic. The pipeline is a bit updated in comparison with the previous version explained in the previous blog.
Conclusion
Using this kind of tool, you can always do a quick check and react if you notice some issues in the processes, but you can also search for processes that were already executed even 90 days ago. Another benefit is that you will also have a detailed report in your mailbox that will help you in doing some analysis or improvements. This is only one way of implementing an external process monitor and we will be happy to get your opinion or idea on this.