
Big companies, especially those that are merged between two or more companies are always deciding to use integration because of its main benefits such as rapid development, big data throughputs, scalability, and many more. How much the projects are increasing, their monitoring and being notified about everything is becoming a nightmare. Notifications are everywhere, most of them are going to your Junk folder because they are useless to you, but you are too busy to turn them off or restructure them and all is becoming one big mess.
SnapLogic has a good notification-handled solution on a pipeline level where notifications are based on some rules and are sending notification emails to a predefined list of email addresses. But, as I said, if we have a high volume system of multiple integrations, well packed with a framework, error handling, logging etc. and have a complex architecture then sending notifications for every single pipeline will get you a full inbox and personal ignorant attitude to this type of emails which will result in losing the main purpose of these notifications.
We, as integration developers, faced many of these difficulties and for that matter, we decided to develop a unified monitoring solution for SnapLogic-specific integrations. Below I will present the tool in a short-described version, but you can always email us for a more detailed explanation, even a demo of it.
A Unified Monitoring Solution for SnapLogic
With only using a JSON configuration file where you are defining a list of parameters that are needed for monitoring your environment/integration/business logic and etc, the person that will monitor, who won’t need to be an IT person, will do their complete job.
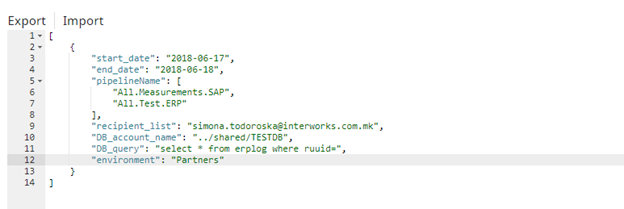
The file above contains parameters that define the logic by which the process is deciding what should be monitored. Dates parameters are defined so the tool can make a call to the SnapLogic REST monitoring API and look for historic executions for a predefined time period. In the pipeline_name parameter we are defining a list of pipelines that we want to monitor, the recipient_list is the list of the email addresses that will receive a notification (actually a whole report) for what happened and in the environment we are defining the organization on SnapLogic level where the pipelines are located.
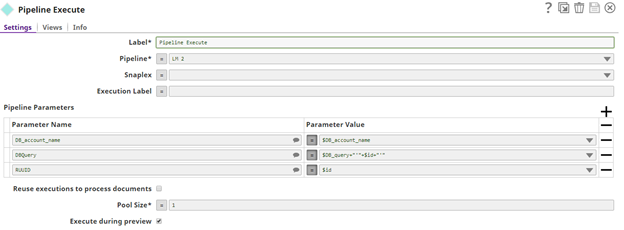
In order to add more value to all this, we made a custom Client specific business logic to the process because we thought that checking only SnapLogic logs is not enough for a complete monitoring tool. Almost every integration project is logging in a DB for what happened. So, in order to be profound and useful, we are adding a logic where the user will define DB account and query a table by which the tool can decide if a Completed transaction in SnapLogic is really completed by Business rules, or it should be in failed state. This will help and add value to the non IT people who will receive the reports, to know what really happened in their system.
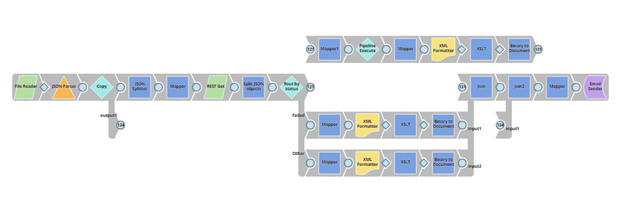
After we defined the JSON configuration file and did some data transformation of it, the next step is to call the REST Monitoring API provided by SnapLogic with a REST Get snap. For more information on how this API should be invoked, visit the SnapLogic Documentation portal where everything is very well explained in detail.
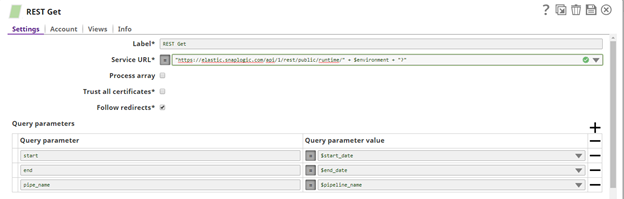
Following to the set of results we are getting, based on the API response, we are routing the status of the pipelines according to their status of execution. Processes with failed status are directly sent to the report, but completed ones are sent to another set of validation logic where it will be decided whether the integration is really completed successfully or not.
As I said earlier, we are sending a query and account in the configuration file by which we will check if the pipeline completed its execution properly. That is a centralized sub-pipeline where we are using the query to get the real status of the pipeline execution.
After we have all the results we need, we are making some XSLT transformations in order to get a good-looking report that will be understandable for the end user.
Example of XSLT transformation that we use for creating the failed table in the report:
<?xml version=”1.0″ encoding=”ISO-8859-1″?>
<xsl:stylesheet version=”1.0″ xmlns:xsl=”http://www.w3.org/1999/XSL/Transform”>
<xsl:template match=”/”>
<table border=”1 px” style=” font-family: verdana,arial,sans-serif;
font-size:11px;border-width: 2px; cellpadding=10; padding: 8px;”  bgcolor=”#F8F8FF”>
<tr bgcolor=”#cd3e32″>
<th>Pipeline Name</th>
<th>State</th>
<th>User</th>
<th>Ccreate Time</th>
<th>RUUID</th>
<th>Documents</th>
<th>Error Documents</th>
</tr>
<xsl:for-each select=”/DocumentRoot/Document/Data”>
<tr style=”border-style:solid; cellpadding=10;”>
<!–ADDING THIS–>
<xsl:if test=”position() mod 2 = 1″>
<xsl:attribute name=”style”>background-color:gray;</xsl:attribute>
</xsl:if>
<!–END ADDING THIS–>
<td>
<xsl:value-of select=”label”/>
</td>
<td>
<xsl:value-of select=”state”/>
</td>
<td>
<xsl:value-of select=”user_id”/>
</td>
<td>
<xsl:value-of select=”create_time”/>
</td>
<td>
<xsl:value-of select=”id”/>
</td>
<td>
<xsl:value-of select=”documents”/>
</td>
<td>
<xsl:value-of select=”error_documents”/>
</td>
</tr>
</xsl:for-each>
</table>
</xsl:template>
</xsl:stylesheet>
The end user will receive an email notification with content like the following report:
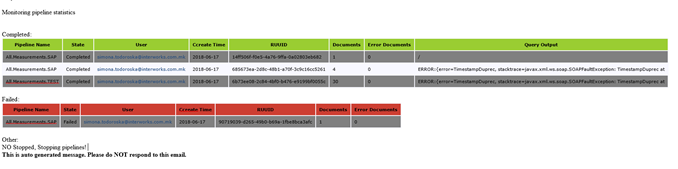
This email report lists multiple pieces of information that are useful for the end user who will use this tool. Of course, this info can be edited based on the end user’s needs. The monitoring tool can be exposed as an API and called from any pre-developed application where the end user will trigger the monitoring tool by clicking some button on a UI or it can be scheduled to run on some predefined interval and generate results, all this depends on the project and user demands.
Conclusion
We all know what are the main benefits of continuous monitoring of the environment and measuring system performance. With this tool, end users will get more insights into what is happening in the system, what they can do to improve something, measuring capacity, and similar. Note that this is only one way of implementing a monitoring tool in SnapLogic, there are plenty of possibilities for improving this. So, if you have one, we will be more than happy to discuss about it with you.