

Introduction
Creating and designing a customizable dashboard for better visualization of data metrics and their interoperability is what every process, business, or department needs for better quality assurance. That makes the analysis easier and better – and with such precise analysis, we can make the processes successful. A data dashboard is the most efficient way to track multiple data sources because it provides a central location for businesses to monitor and analyze performance. Real-time monitoring reduces the hours of analyzing and the long line of communication that previously challenged businesses.
JMeter is an Open Source testing software. It is a 100% pure Java application for load and performance testing. JMeter is designed to cover categories of tests like load, functional, performance, regression, etc. (Find out more jmeter.apache.org)
InfluxDB is a time-series database designed to handle high write and query loads. It is an integral component of the TICK stack. InfluxDB is meant to be used as a backing store for any use case involving large amounts of timestamped data, including DevOps monitoring, application metrics, IoT sensor data, and real-time analytics. (Find out more on influxdata.com)
Grafana is open-source visualization and analytics software. It allows you to query, visualize, alert on, and explore your metrics no matter where they are stored. In plain English, it provides you with tools to turn your time-series database (TSDB) data into beautiful graphs and visualizations. (Find out more on grafana.com)
We can see that all these 3 resources can be connected in order to have a beautiful, continuous, precise, and most importantly user-friendly dashboard that anyone can read and distinguish the deviation of executing the tests in a time frame. We can explore data through ad-hoc queries and dynamic drill-down, split view and compare different time ranges, queries, and data sources side by side.
JMeter, InfluxDB and Grafana Integration
JMeter configuration
JMeter is a software that can perform load tests, performance-oriented business (functional) tests, regression tests, etc., on different protocols or technologies. JMeter is a Java desktop application with a graphical interface that uses the Swing graphical API. It can therefore run on any environment/ workstation that accepts a Java virtual machine, for example − Windows, Linux, Mac, etc. JMeter simulates a group of users sending requests to a target server and returns statistics that show the performance/ functionality of the target server/application that can be seen in the included listeners such as tables, graphs, etc.
We will not cover here how the test script is created, but we will focus more on its output and real-time results. With JMeter 2.13 we can get real-time results sent to a backend through the Backend Listener using potentially any backend (JDBC, JMS, Webservice, …) by providing a class that implements AbstractBackendListenerClient. In the Listener, we can choose between GraphiteBackendListenerClient and InfluxDBBackendListenerClient classes.
InfluxDBBackendListenerClient allows sending metrics to an InfluxDB Backend using UDP or HTTP protocols. This feature provides:
- Live results
- Nice graphs for metrics
- Ability to compare 2 or more load tests
- Ability to add annotations to graphs
- Storing monitoring data as long as JMeter results in the same backend
We will use the InfluxDBBackendListenerClient as a simpler way to perform an additional JMeter Grafana integration. With InfluxDBBackendListenerClient actually, output metrics such as application and transaction (that we set in the Backend Listener), status (success-ok or fail-ko), avg (average response time), count (number of samplers), max (maximum response time), min (minimum response time), pct90.0, pct95.0, pct99.0 (percentiles 90%, 95 and 99% computed for responses of sampler name), RB (received Bytes), SB (sent Bytes) and timestamp (which shows the date and time, in RFC3339 UTC) are sent as Asynchronous HTTP calls to InfluxDB database:
curl –i –XPOST “http://localhost:8086/write?db=IWdb” —data-binary “jmeter_measurement,application=BackendListener,statut=all,transaction=HTTPRequest avg=529.7,count=4,max=1074,min=337,pct90.0=1022.5,pct95.0=1034.9,pct99.0=1073.89,rb=55976,sb=960 1604490173757000000”
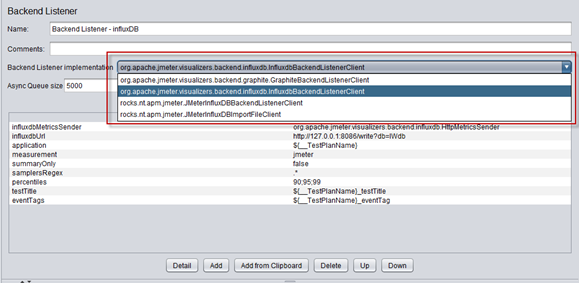
(Image 1: Backend Listener configuration in JMeter)
- influxdbMetricsSender – this is the class for sending metrics to InfluxDB. Keep it as default.
- influxdbUrl – the URL of InfluxDB is in the following format: http://%5Binfluxdb_host%5D:%5Binfluxdb_port%5D/write?db=%5Bdatabase_name%5D, in our case, the URL will be http://127.0.0.1:8086/write?db=IWdb (we have to create the first database on our own before running the test. JMeter is not creating the DB automatically as measurements)
- application – we can store metrics from different applications under one database. Our practice is to add ${__TestPlanName} variable which will store and aggregate the metrics by the test script name.
- measurement – the name of the measurement (table) that will be stored in InfluxDB. The default value in the Backend Listener is ‘jmeter’, but as mentioned above whatever name is accepted because automatically will be created if it is not existing. “jmeter” is configured for simplicity of the Grafana dashboard template setting.
- summaryOnly – if you want to keep summary results in the database and do not want to collect all the detailed metrics during test execution set to ‘true’.
- samplersRegexp – use the regexp expression to filter specific metrics that you want to store in a database. Use the default “.*” value if you want to store all your metrics.
- percentiles – metrics percentiles that should be sent to the database.
- testTitle – give your test a name.
- eventTags – a list of tags that will be stored in the ‘events’ measurement of InfluxDB, which is automatically created during the initial run of the test. The “events” measurement is keeping info such as the time when the test is started and when it is ended.
InfluxDB Configuration
InfluxDB is a time-series database designed to handle high write and query loads. It is an integral component of the TICK stack. InfluxDB is meant to be used as a backing store for any use case involving large amounts of timestamped data, including DevOps monitoring, application metrics, IoT sensor data, and real-time analytics.
The open-source edition of InfluxDB runs on a single node. There is also an option to use a cloud solution that doesn’t require any installation but its free edition is limited to users and scalability. In this documentation, we are using on-premise solution. It can be downloaded from: https://portal.influxdata.com/downloads/ – InfluxDB Time-Series Data Storage suitable for used OS.
After the server is started, we can run influx.exe for CLI iteration with the data series databases. The CLI communicates with InfluxDB directly by making requests to the InfluxDB API over port 8086 by default.
The initial main command is SHOW DATABASES – to check created databases. We will have only the “_internal” database on the initial run. To create a new database through CLI we will use the following commands:
CREATE DATABASE IWdb
USE IWdb – in order to connect with the required db.
Additionally, if you want to create a user, with all privileges, you can use:
CREATE USER some_user WITH PASSWORD ‘some_pass’ WITH ALL PRIVILEGES
By default, InfluxDB uses the following network ports:
- TCP port 8086 is available for client-server communication using the InfluxDB API.
- TCP port 8088 is available for the RPC service to perform backup and restore operations.
Other useful commands are:
- SHOW MEASUREMENTS (after ‘USE db’ – we can list included measurements in that db)
- SHOW TAG KEYS (will list all the TAG KEYS associated with the measurement/s)
- SHOW FIELD KEYS (will list all the FIELD KEYS associated with the measurement/s)
- SELECT * FROM measurement_name (we can see all the data) etc.
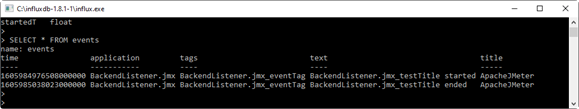
(Image 2: InfluxDB measurement interaction)
In order to avoid starting and stopping the server on every run – or to avoid manual interaction with the server – especially if the server is located on another machine, there is a way that we can configure the server as a service.
Grafana configuration
Grafana is open-source visualization and analytics software. It allows you to query, visualize, alert, and explore your metrics no matter where they are stored. In plain English, it provides you with tools to turn your time-series database (TSDB) data into beautiful graphs and visualizations.
Grafana can be downloaded from here, and it is available as a free source on-premise and cloud limited free edition. Open and run the installer. In this documentation, we will use on-premise Grafana as a locally installed server and we can access http://localhost:3000/, with default root user admin with password admin. After the first entry, it will prompt you to change it, and also you can create as many users with different privileges as you need.
The first we do when we log in, we define a data source in order to get the connection with the stored time-series metrics and after that, we can use the data source in our dashboards. We do not have a default or sample Dashboard included in the installation of Grafana, but there are a lot of online free templates for dashboards for different data sources, which are very easy to implement just by adding the Unique ID or JSON body from here.
IW Dashboard Configuration:
IW Dashboard uses InfluxDB data sources to present JMeter and Jenkins metrics during performance or functional test runs.
The variables that can be selected for the display of the metrics are located at the top.
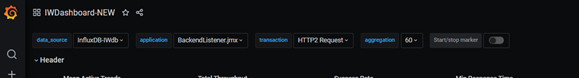
(Image 3: Location of the variables in the dashboard where you can set the desired value)
You can see them as filters. The variables are configured in the main Dashboard settings -> Variables (check the image below) and you can easily add new or remove existing ones, or if you are more comfortable by editing JSON you can do that in the main JSON Model:
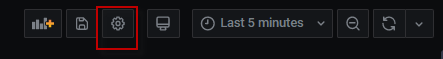
(Image 4: Dashboard settings button)
- data_source (Type: Datasource – Enables you to dynamically switch the data source for multiple panels). It is set to InfluxDB data source because for this Dashboard we use InfluxDB but if you use another data source (Prometheus, MySQL, Elasticsearch, Microsoft SQL Server, etc) you can easily change it from here – but first, you need to have added that Data Source and establish the connection in the main Grafana configuration settings:
- application (Type: Query – Variable values are fetched from a data source query). It is set to get all the values for the application tag key from the configured data_source: SHOW TAG VALUES FROM “$measurement_name” WITH KEY = “application” (this is set in JMeter Backend listener and our practice is to set its value as TestPlanName).
- transaction (Type: Query – Variable values are fetched from a data source query). It is set to get all the values for the transaction tag key for the chosen application (test plan) with the following query: SHOW TAG VALUES FROM “$measurement_name” WITH KEY = “transaction” WHERE “application” =~ /^$application$/ AND “transaction” != ‘internal’ AND “transaction” != ‘all’ – this will show all the samples run in the test plan.
- measurement_name (Type: Constant – Define a hidden constant variable, useful for metric prefixes in dashboards you want to share). This variable value is set to “jmeter” as constant – but if you set a different name in the Backend Listener for measurement name you need to change it here also.
- send_interval (Type: Constant – Define a hidden constant variable, useful for metric prefixes in dashboards you want to share). This variable value is set to 5 because the Backend Listener’s default send interval value is 5 seconds. If you choose to change that – you can do that in the jmeter.properties (properties file in JMeter bin location) in the section for Influx Backend (backend_influxdb.send_interval=5)
- aggregation (Type: Custom – Define variable values manually). Here we set the test duration time in seconds. Several values are added 1,10,30,60,600,1800,3600 but if you run the test for a longer period of time or other than that specified you can add it here and it will be shown in the dropdown menu and be able to select in the dashboard. It is an important value for calculating the metrics in the Dashboard panels.
$timeFilter variable is set by the time selection that you choose. If you need to set the new variable you can do it by selecting the new variable button.
IW Dashboard includes the following sections
- Summary: Stat, Gauge, and Table panels are used to present the total number of requests executed, number of failed requests, Sum of received and sent bytes and summary table results with average metrics for the throughput and received and sent bytes (KB/sec).
- Graph Summary – This is a section where we can see all of the above metrics in a time interval (default is on every 5s) presented in graph panels:
- Errors – tabular view of the error messages and the sum of the errors that occurred in each transaction
- Individual Transaction summary – it shows the Average, 90% Percentage, 95% Percentage, 99% Percentage, Minimum and Maximum response time for selected transaction in a time interval (the time interval is set in jmeter.properties file, and the default value is set to 5s)
- Jenkins Run Reports: The Jenkins Executions section is a section where we can see all the data for the Jenkins run: when the job was executed, the duration of the build, the status of the build, the last stable or successful build, etc. To have this data in InfluxDB we need to add the InfluxDB plugin in Jenkins in order to send it to our database:
Conclusion
IW template dashboard is designed to fulfill our requirements in performance and functional testing with JMeter and Jenkins – so the panels designed show all needed metrics to analyze the results and something that is even more important they can be visualized and understood by the client from any department. It is easy to configure, redesign, and customize to meet the specific needs of a department and company. The Dashboard is available for free download from the official Grafana page with ID: 13619.