

Setting up JMeter tests on Azure DevOps is easy because Azure is a cloud solution that has everything set up (Java, ANT, Mail notifications for the team etc.) and a senior php engineer can definitely set this up very quickly. Besides this, it also gives us the possibility to select a server place where we want to build our test (Europe, North America, Asia, etc.).
One of the best features that Azure DevOps offers, executing JMeter load tests was removed on 31 March 2020. But, there is nothing to fear, because the Jmeter Azure DevOps integration in the sense of executing JMeter performance test is still possible and we will explain all that in our article.
Register on Azure DevOps
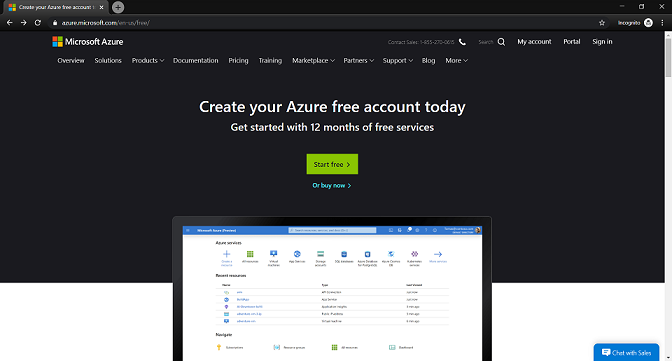
To start using Azure navigate to the following link: https://azure.microsoft.com/en-us/free/ and click on the ‘Start Free’ button.
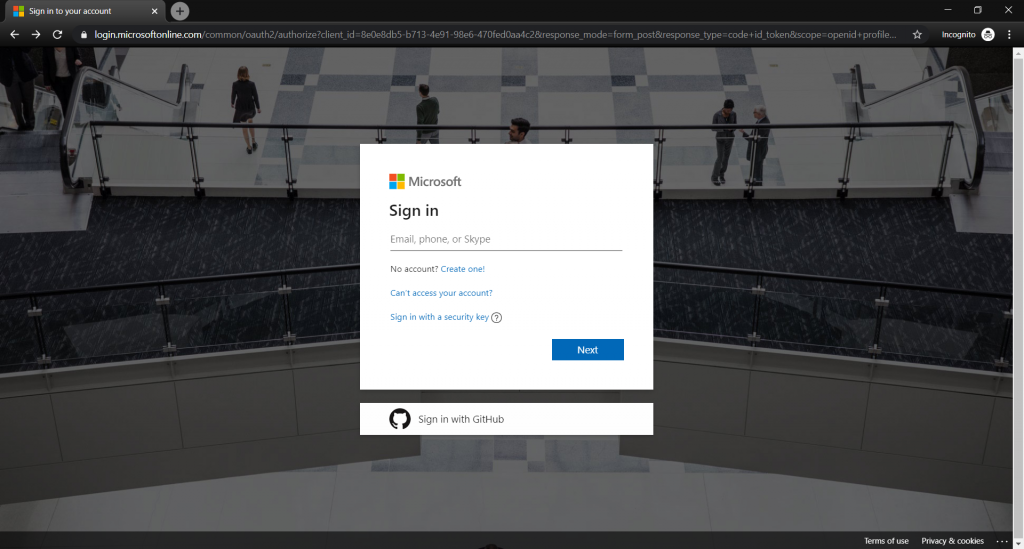
On the next screen, you can use an existing Microsoft Azure performance testing account to log in, you can create a new one or log in using GitHub authentication. In my case, I will use GitHub authentication.
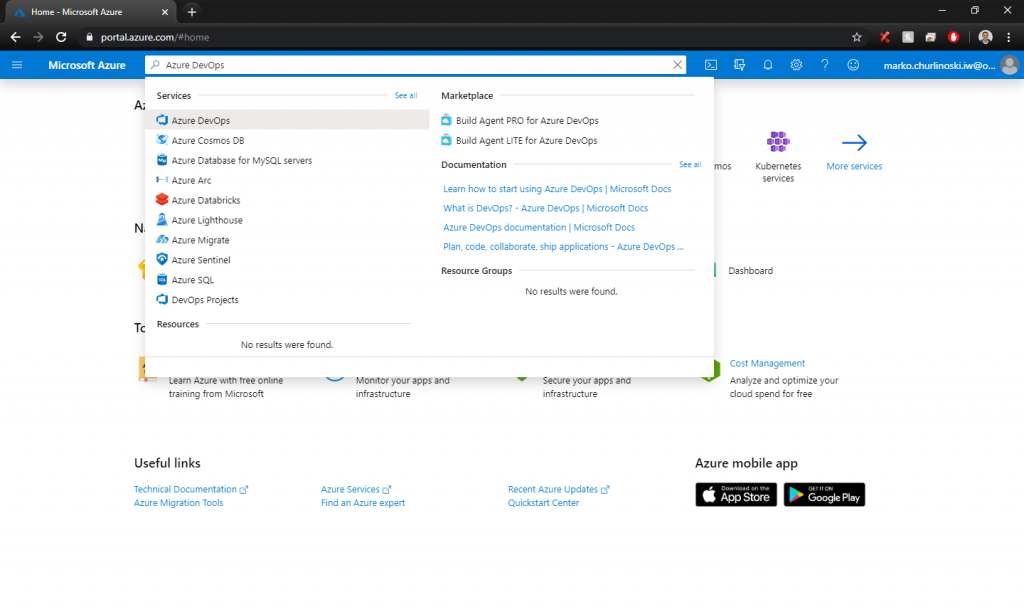
After you have successfully signed up, navigate to: https://portal.azure.com/ and in the top search bar search for ‘Azure DevOps’ select the first suggestion.
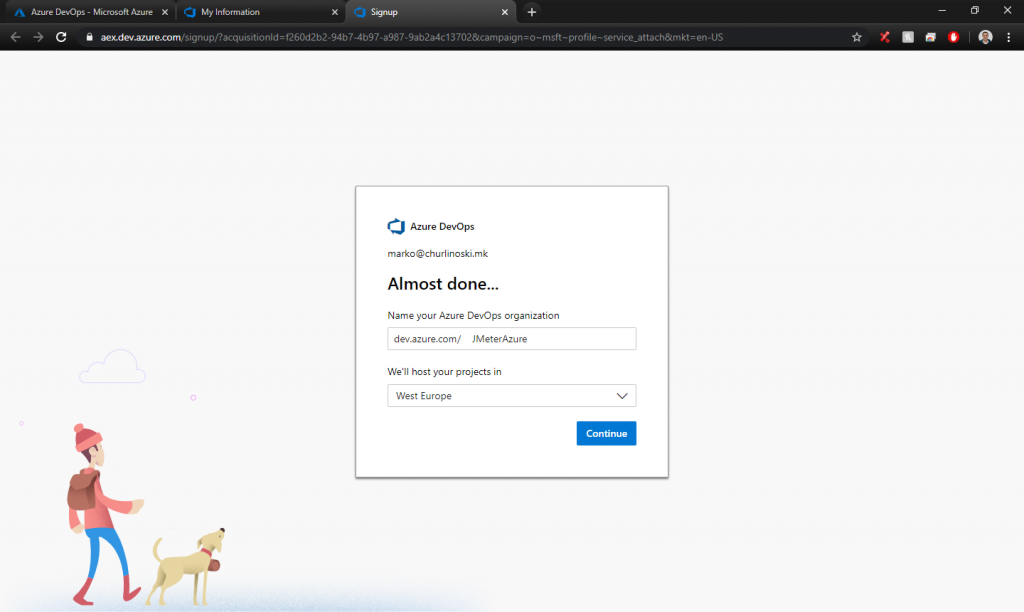
On the next screen click ‘My Azure DevOps Organizations’ and then click on the ‘Create a new organization’ button and accept the Terms and Conditions. The screen that will appear afterward will ask you to name the organization and to select your server location. Once you have done all that click continue. In my case, I will use ‘West Europe’.
Setup your first project
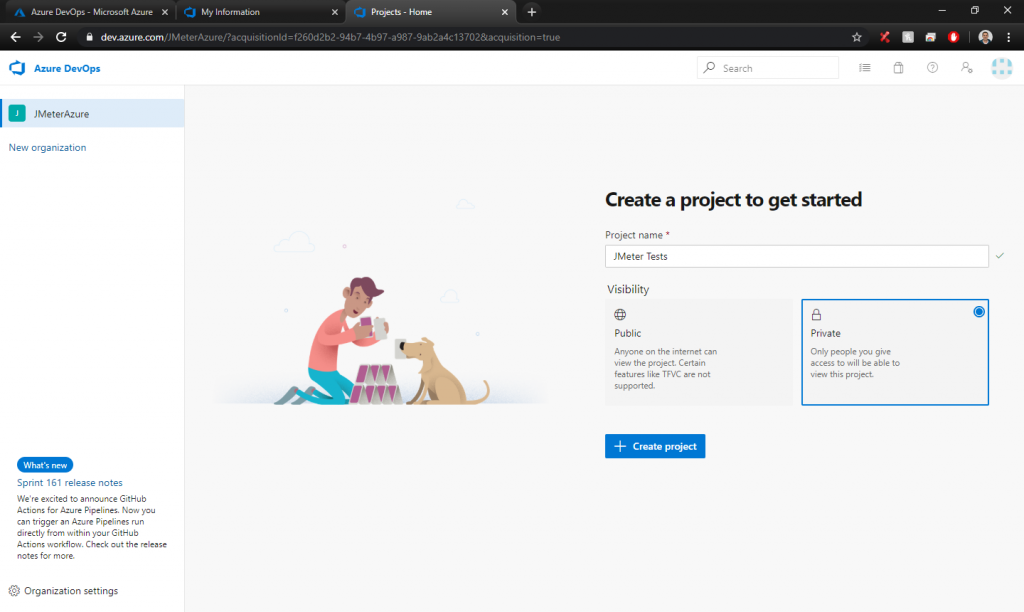
After you have created your organization, you will be redirected to create your first project. Give a name to the project, select if the project is Public or Private and click on the ‘Create Project’ button.
After you create your first project navigate to ‘Pipelines’ and then ‘Builds’ and then click on the ‘New pipeline’ button.
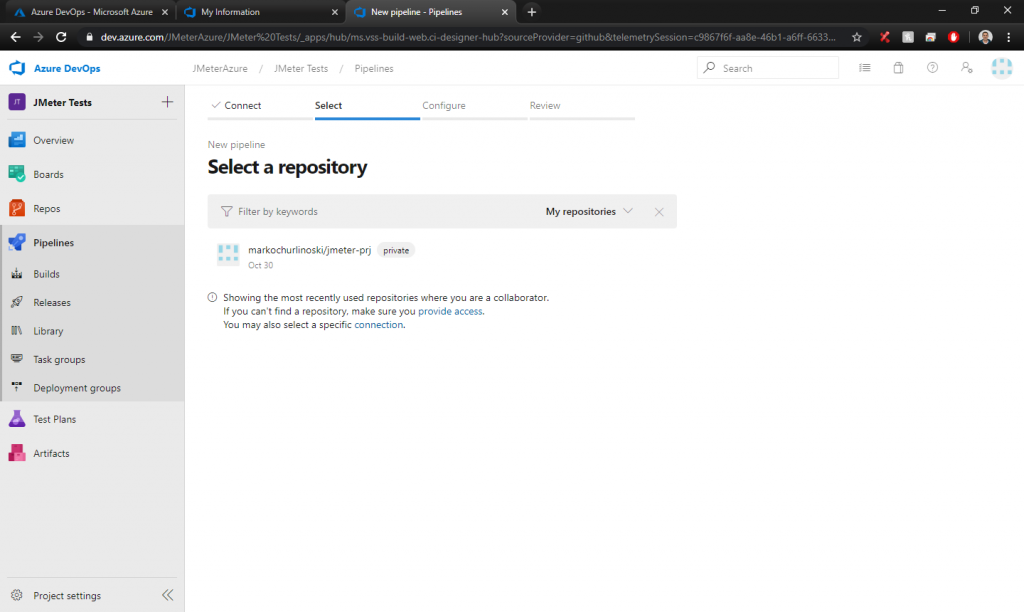
The first thing to do when creating a new pipeline is to select the source code location. In my case, I will use the GitHub repository. After successfully connecting to my GitHub account, I have selected the needed repository.
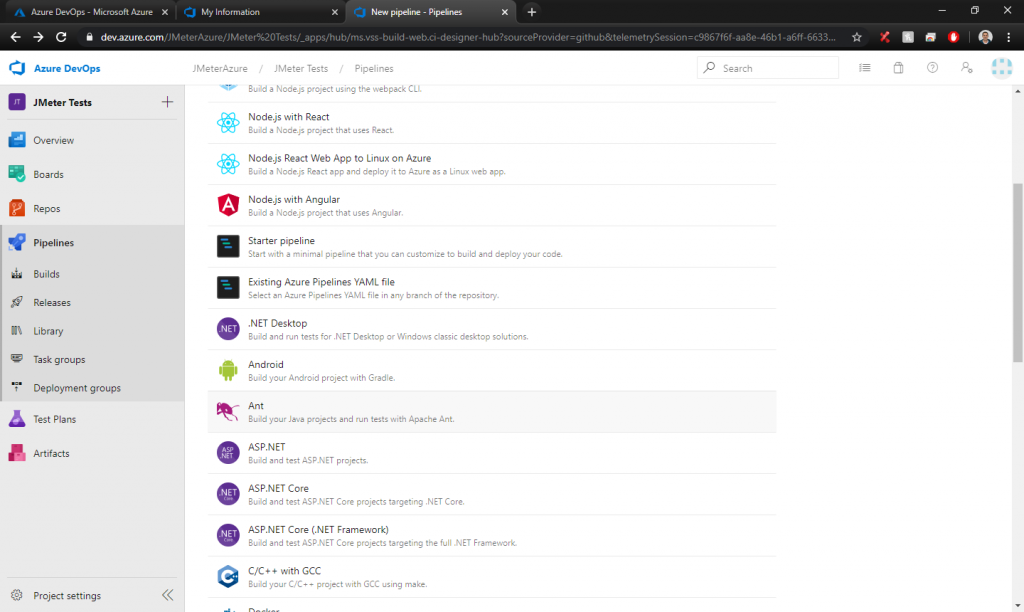
After selecting the repository, we need to configure the Jmeter Azure pipeline. To execute the JMeter tests I will use Apache ANT.
Add plugins from the market
The continuation of our Jmeter with Azure DevOps journey in order to add pipeline tasks, we need 2 plugins:
- File Content to Variable – for preparing the test results to be sent via email
- Send Email– to send an email with results after test execution
These plugins can be installed using the market place.
After you find the needed plugin just click the ‘Get it free’ button
Configure a functional JMeter test
In order to execute JMeter Azure DevOps tests in our example, we will use the ANT script. Below you can see a description of a used ANT script.
Define a project with destination directory and set global property “jmeter.home” with the path to the JMeter installation folder and Define a class path with the location of the “ant-jmeter-1.1.1.jar”:
<path id=”ant.jmeter.classpath”>
<fileset dir=” D:\a\1\s ” >
<include name=”ant-jmeter-1.1.1.jar”/>
</fileset>
</path>
Create a jMeter ant task that will point to the class “JMeterTask”:
<taskdef name=”jmeter” classname=”org.programmerplanet.ant.taskdefs.jmeter.JMeterTask” classpathref=”ant.jmeter.classpath” />
Clean the directories with the results and the log file and create new directories for storing the new results:
<target name=”clean”>
<delete dir=”results”/>
<delete file=”jmeter.log”/>
<mkdir dir=”results/jtl”/>
<mkdir dir=”results/html”/>
</target>
Execute single or multiple JMeter tests by using the “<testplans>” tag, set the format and the output directory for the results. You can also specify JVM arguments to the JVM launched to run Jmeter:
<target name=”test” depends=”clean”>
<jmeter jmeterhome=”${jmeter.home}” resultlogdir=”results/jtl”>
<testplans dir=”${basedir}” includes=”CreateOrder.jmx”/>
<property name=”jmeter.save.saveservice.output_format” value=”xml”/>
<jvmarg value=”-Xmx1536m”/>
</jmeter>
</target>
Generate HTML and JUnit-XML reports from the JTL results file by using an XSLT transformation.
<target name=”report” depends=”test”>
<xslt basedir=”results/jtl” destdir=”results/html” includes=”*.jtl” style=”${basedir}\jmeter-results-detail-report_21.xsl”/>
</target>
<target name=”unit” depends=”test”>
<xslt basedir=”results/jtl” destdir=”results/unit” includes=”*.jtl” extension=”.xml” style=”${basedir}\jmeterUnitReport.xsl” />
</target>
In the YAMAL configuration, first, we need to change pool vmImage to ‘windows-latest’. This command defines the type of machine where tests will execute.
After that, we need to add pipeline steps.
The first step will be executing ant:
– task: Ant@1
displayName: Execute JMeter script
inputs:
buildFile: ‘build – Create_Customer.xml’
publishJUnitResults: false
javaHomeOption: ‘JDKVersion’ # Options: jDKVersion, path
- The display name is the step name in the console log. This is used for easier debugging of the failed steps.
- Build file is our ant script that needs to be executed.
- Publish JUnit results is false in my case because I don’t want to have results.
- Java home option is setting the path of the JAVA_HOME.
The second step will be preparing the test results for email sending:
– task: CmdLine@2
displayName: Prepare test results
inputs:
script: |
cd D:\a\1\s\results\html
dir
powershell -command “\”$(Get- Content Create_Customer.html)\” > report.html”.
This step executes batch commands to eliminate all new rows for the email, and create a new file ‘report.html’.
The third step will copy the content from the report.html file and will place it into a variable with a name ‘html’
– task: FileContenttoVariable@2
displayName: Set test results as variable
inputs:
FilePath: ‘D:\a\1\s\results\html\report.html’
VariableName: ‘html’
AddNewlines: false
The fourth step will publish the test results from the executed tests and make visual representation in Azure DevOps.
– task: PublishTestResults@2
displayName: Publish JMeter test results
inputs:
testResultsFormat: ‘JUnit’
testResultsFiles: ‘results/unit/Create_Customer.xml’
testRunTitle: ‘Create Customer’
- The test results must be in JUnit format.
- In the Test results file, we give the relative path to the location of our results.
- In the Test run title we give the name of our test run (I put test name in this filed).
The fifth step is for sending an email with results.
– task: SendEmail@1
inputs:
To: ‘marko@churlinoski.mk’
From: ‘azure-devops@churlinoski.mk’
Subject: ‘JMeter test results’
Body: ‘$(html)’
BodyAsHtml: true
AddAttachment: false
SmtpServer: ‘mail.churlinoski.mk’
SmtpPort: ’25’
SmtpUsername: ‘azure-devops@churlinoski.mk’
SmtpPassword: ”
UseSSL: false
For this step, you will need a ‘Send Mail’ extension. You must specify the SMTP server, SMTP username, and SMTP password.
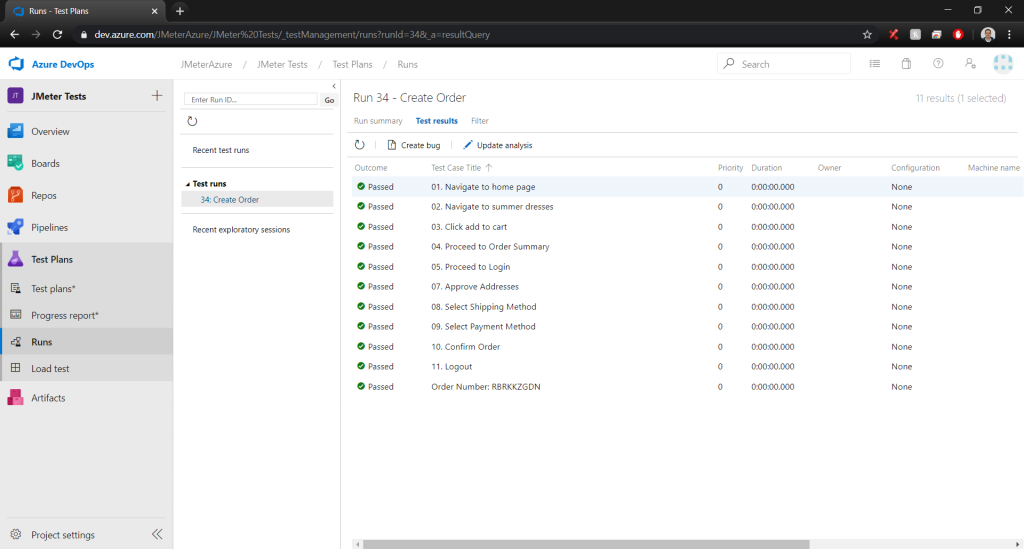
After successfully executed pipeline we should have the test results in Test Plans > Runs and receive an e-mail with the test results.
Configure performance JMeter test
Azure DevOps supports cloud-based Azure load testing tools execution, but this service was deprecated on March 31, 2020. Because of that, we will need to set up the performance tests as a Jmeter Azure DevOps pipeline also. Configuring performance test is almost the same as for functional tests.
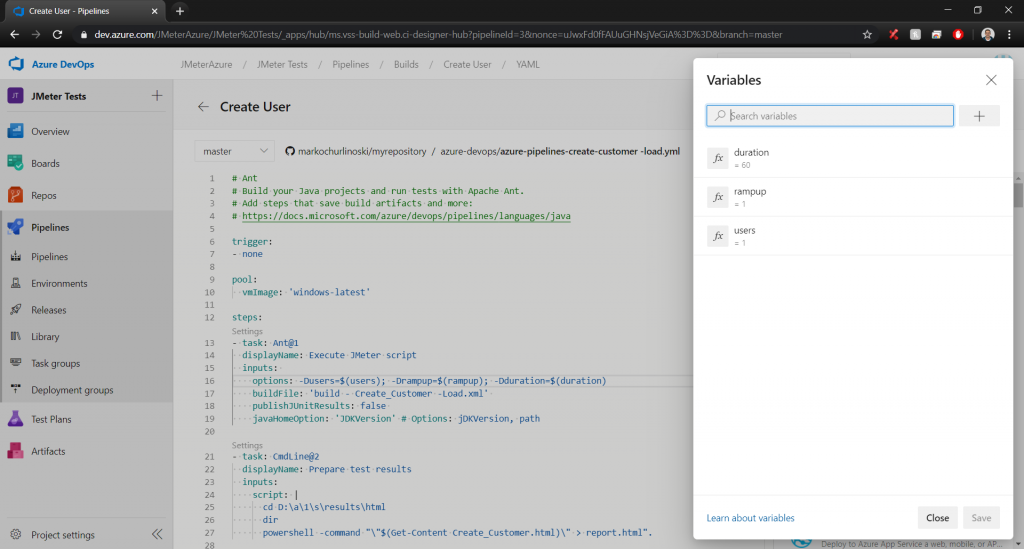
First, we need to add variables for the execution. In my case I will add 3 variables:
- For setting the number of users (thread)
- For setting ramp up time
- For setting duration of the test
To add variables in the pipeline, while configuring the pipeline click on the ‘Variables’ button and then click on the button with a plus on it.
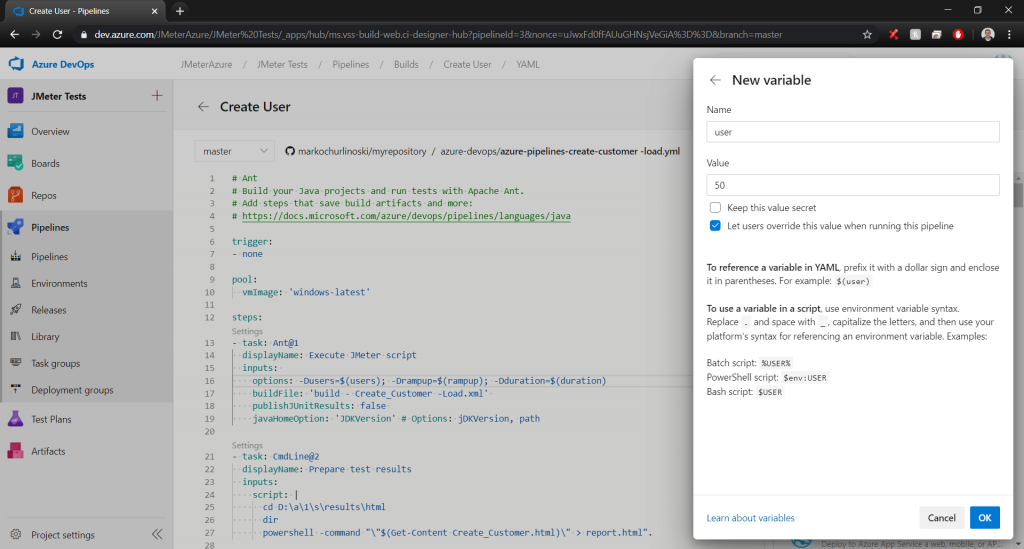
On the next screen give the variable name in the ‘Name’ textbox, default value in the ‘Value’ textbox, check the ‘Let users override this value when running this pipeline’ option and then click ok.
In the ANT build file we need to add the xalan and serializer libraries for calculating and representing average, min and max time of the request execution:
<path id=”xslt.classpath”>
<fileset dir=”apache-jmeter-4.0\lib” includes=”xalan*.jar”/>
<fileset dir=”apache-jmeter-4.0\lib” includes=”serializer*.jar”/>
</path>
Also we need to pass the variables to the JMeter script in the ‘test’ target:
<target name=”test” depends=”clean”>
<echo>Users: ${users}</echo>
<echo>Ramp Up: ${rampup}</echo>
<echo>Duration: ${duration}</echo>
<jmeter jmeterhome=”${jmeter.home}” resultlogdir=”results/jtl”>
<testplans dir=”${basedir}/tests/load” includes=”Create_Customer.jmx”/>
<property name=”jmeter.save.saveservice.output_format” value=”xml”/>
<jvmarg value=”-Xmx1536m”/>
<property name=”users” value=”${users}”/>
<property name=”rampup” value=”${rampup}”/>
<property name=”duration” value=”${duration}”/>
</jmeter>
</target>
In the YAML file, we need to remove the step for publishing a JUnit report (Step number 4). Also, the step for executing the ant is changed:
– task: Ant@1
displayName: Execute JMeter script
inputs:
options: -Dusers=$(users); -Drampup=$(rampup); -Dduration=$(duration)
buildFile: ‘build – Create_Customer -Load.xml’
publishJUnitResults: false
javaHomeOption: ‘JDKVersion’ # Options: jDKVersion, path
The new thing here is the ‘option’ in ‘inputs’. With this input, we pass the variable parameters to the ant build file and the JMeter DevOps script.
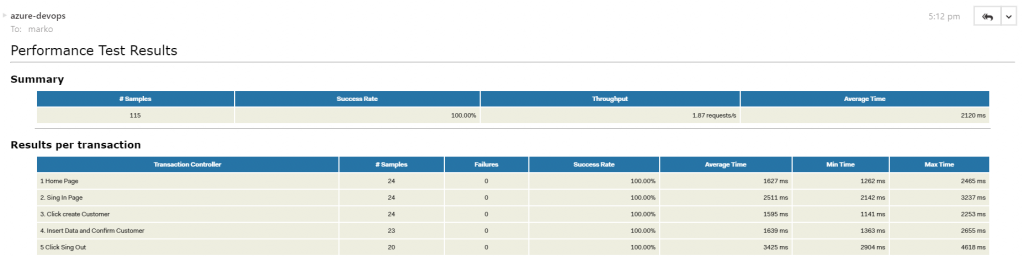
After the pipeline is executed successfully, we will receive an email with the test results of our Azure Jmeter adventure.
Conclusion
Azure DevOps is a fun DevOps load testing tool to play with. It has a lot of features that are easy to use. The official documentation is very understandable and it helped me a lot while writing this blog. It is really important that we don’t have to spend time setting up our machine, and even though Azure load testing deprecated on March 31, 2020, as you can see, there’s still an excellent solution. All we have to do is make the configuration and run the tests. Unfortunately, Azure DevOps is not a free tool.
Regardless, Azure DevOps is a great tool for executing JMeter tests, which can be very useful during the development cycle. Therefore, the Jmeter integration with Azure DevOps is the perfect solution for your challenges!