
Introduction
In today’s world, it is necessary for IT engineers to take care of the performance of the product they are creating. Besides the traditional protocol testing, we have introduced web performance testing. This trend is a must when developing modern applications that are rich in JavaScript, CSS and AJAX.
In the next series of blog posts, you can read about the testing tools we have used to test the actual end-user experience from a performance perspective.
About LoadView
LoadView is a cloud-based platform that offers three different services (solutions):
- Monitor
- Load Testing
- Dotcom-Tools
The “Monitor” solution gives you a comprehensive picture of web performance and availability trends by automatically monitoring a web resource 24/7 from global monitoring locations. The “Monitor” software constantly tests the web application for uptime, speed, and proper functionality. It monitors from the end-user’s perspective and allows you to keep tabs on monitoring issues.
The “Load Testing” solution provides testing services to test websites, web applications, and API performance under simulated load. The “Load Testing” solution can support up to 1,000,000 concurrent users for HTTP performance tests and up to 100,000 concurrent browser users for UI performance tests.
The “Dotcom-Tools” solution is a combination of both “Monitor” and “Load Testing”.
Load Testing Types
LoadView supports several load testing types: HTTP/S, Web Page, Web Applications, Streaming Media, SOAP Web API, REST Web API, and Postman Collection.
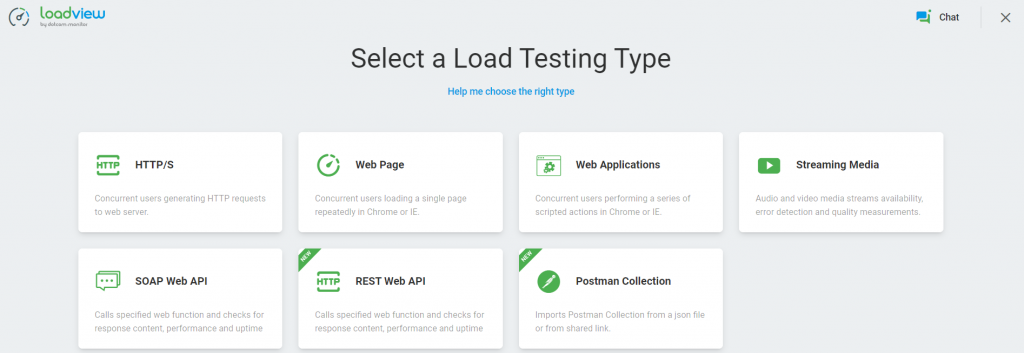
- HTTP/S – Concurrent users generating HTTP requests to a web server.
- Web Page – Concurrent users loading a single page repeatedly in Chrome or IE.
- Web Applications – Concurrent users performing a series of scripted actions in Chrome or IE.
- Streaming Media – Audio and video media stream availability, error detection, and quality measurements.
- SOAP Web API – Calls specified web function and checks for response content, performance, and uptime of the SOAP web service.
- REST Web API – Calls specified web function and checks for response content, performance, and uptime of the REST web service.
- Postman Collection – Imports Postman Collection from a JSON file or from a shared link. (For more details, please refer to the official LoadView documentation link.)
Web Applications Load Testing
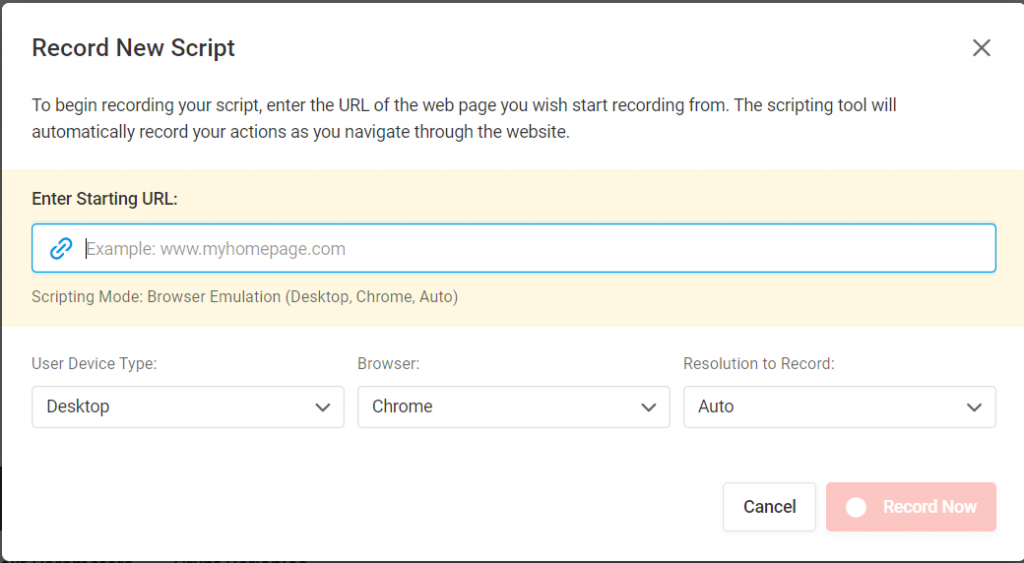
Web Applications testing type simulates concurrent users performing a series of scripted actions using Chrome or IE. To create the load test script, we can record the steps with the “Everystep Recorder” tool or we can import a script from an existing test or upload it from a local machine. When we select “Web Applications” from the main page it will navigate to the “Everystep Recorder”. In the “Record New Script” pop-up we should enter the starting URL, select the user device type (Desktop or Mobile), browser (Chrome or IE) and resolution to record (from 800×600 to 1920×1080) in order to start recording the test script. In our case, we will use a Desktop device, Chrome browser, and a resolution of 1920×1080.
We will create a simple script on a free testing site OrangeHRM with the following steps:
- “OrangeHRM” Login page (https://orangehrm-demo-6x.orangehrmlive.com)
- Login with EES User
- Navigate to My Timesheets Page
- Add Activity
- Remove Activity
After the recording is finished we will execute the script once to validate that it completes all steps. In order to save the script, we will create a new device with the name “First Test”.
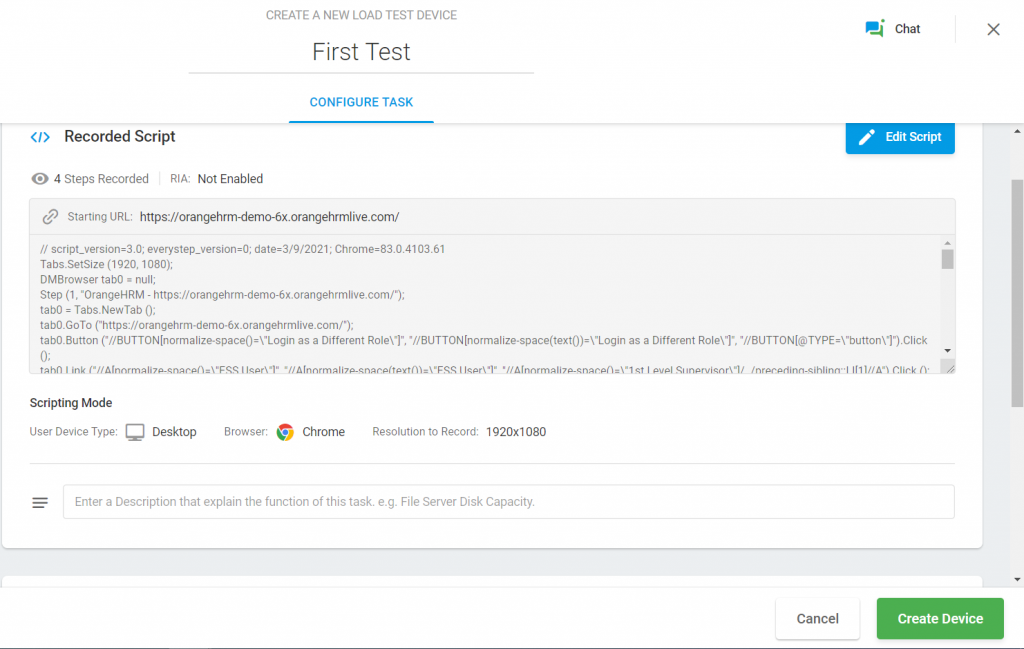
Once we create a new device, a new load test scenario will be automatically created.
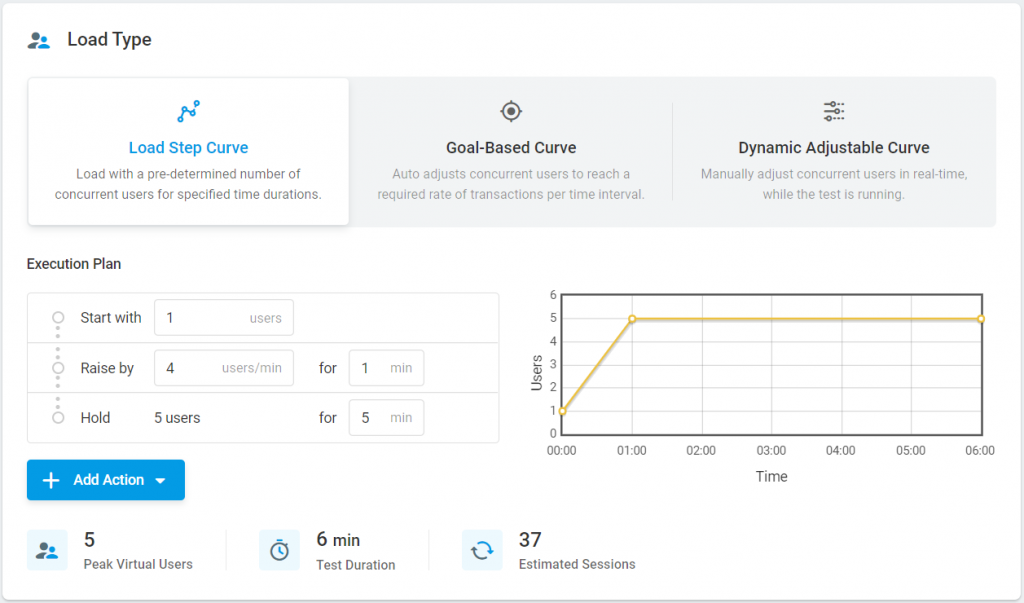
In the “Load Type” section we can set the load configuration. There are three types of load configuration: Load Step Curve, Goal-Based Curve, and Dynamic Adjustable Curve. In our case, we will use the Load Step Curve. The test will be executed with 5 users for 5 minutes peak load with a ramp-up of 1 minute.
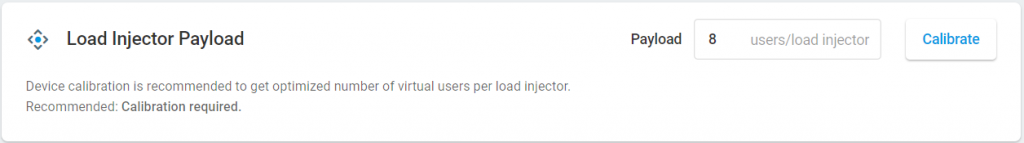
In the “Load Injector Payload,” we can set the number of users per load injector. The default value is 8 users per load injector.
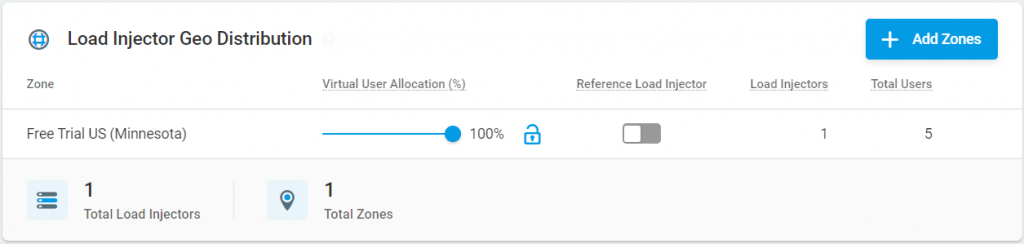
In the “Load Injector Geo Distribution,” we can add different zones for the load injectors, and set the number of load injectors, in our case, we will use only one load injector.
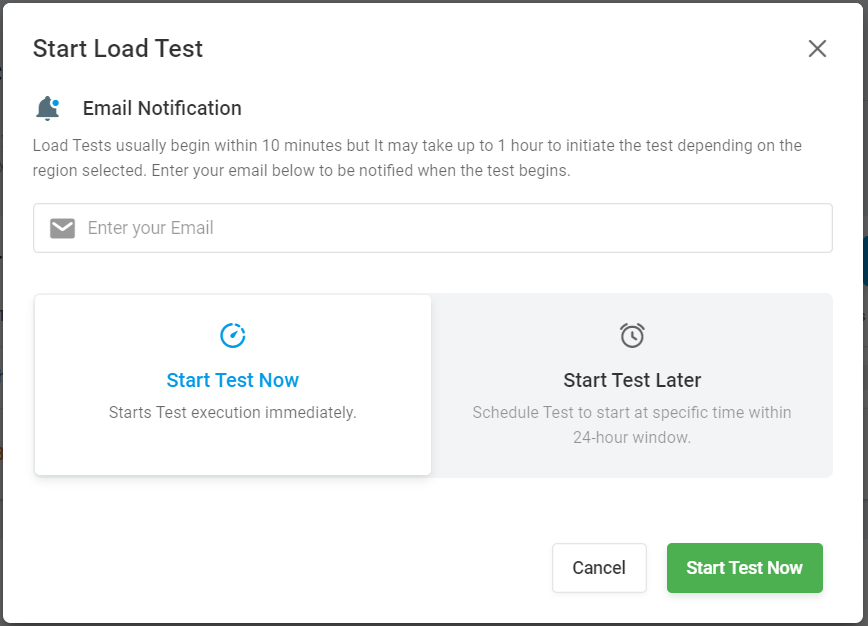
After everything is set up, by clicking on the “Continue” button a pop-up will be displayed where we should enter the email address to get the notification when the test will be started. Sometimes it takes from 10 minutes to 1 hour to initiate the test depending on the region that is selected.
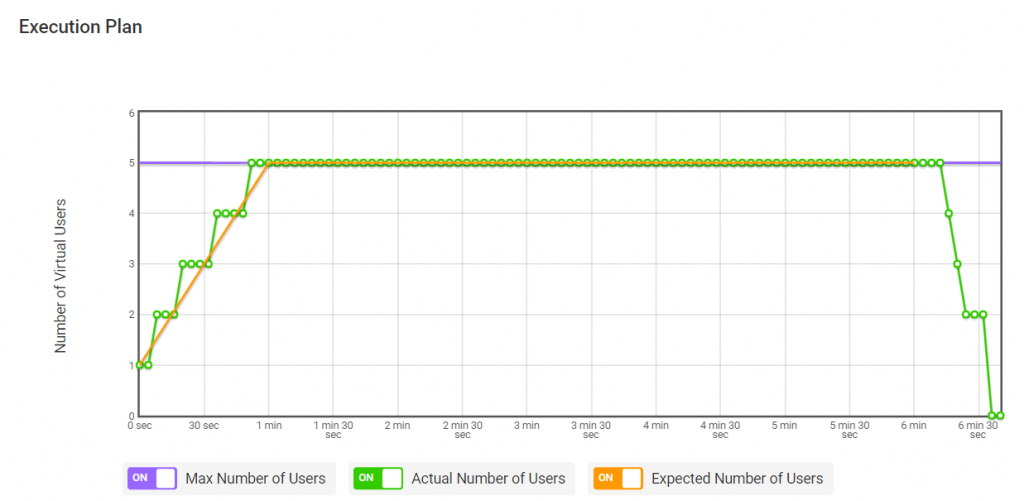
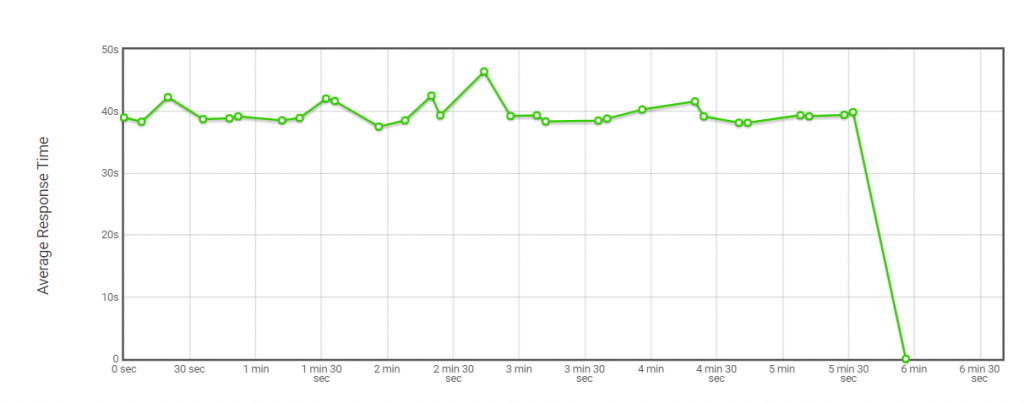
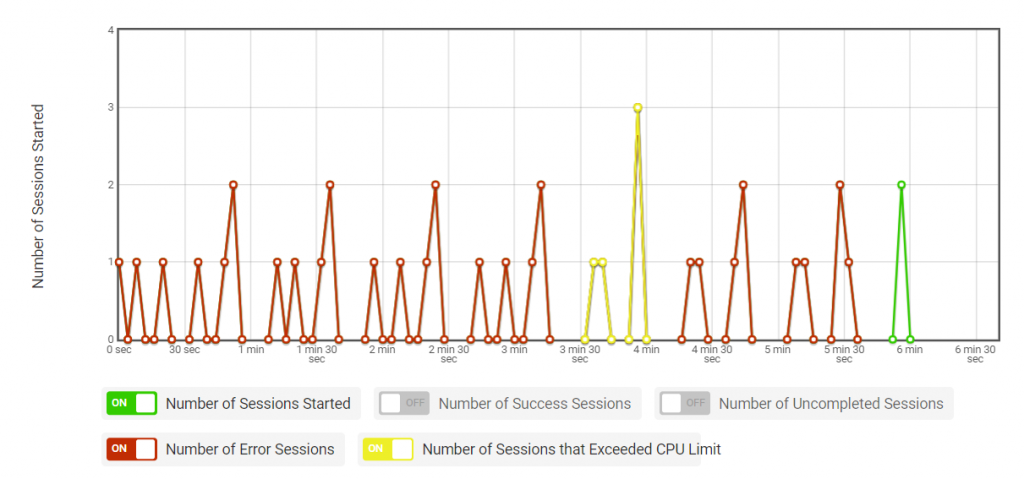
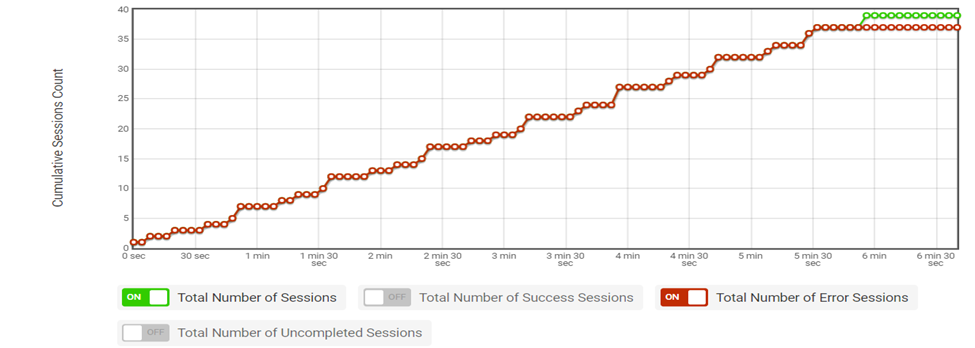
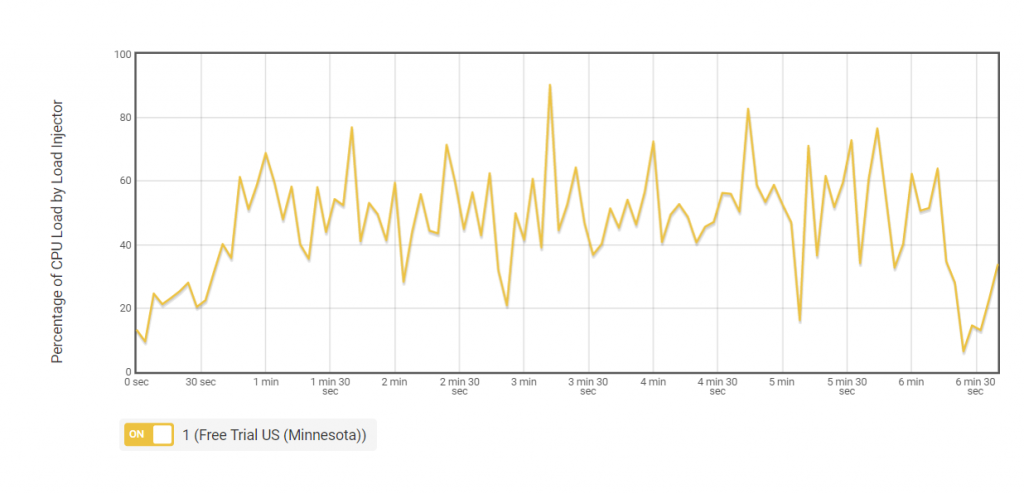
After the test is finished, we will receive an email with the PDF report with the results. The test report contains a few graphs of the performance test results: Execution Plan (Number of Virtual Users), Average Response Time, Number of Sessions Started, Cumulative Sessions Count, Number of Errors by Error Type, and Percentage of CPU Load by Load Injector.

Conclusion
LoadView is a great cloud-based platform that offers different solutions for monitoring the performance of the application and can be also used for load test execution. Load Testing solution supports different types of load testing: HTTP/S, Web Site, Web Application, REST API, SOAP API, and Media Streaming and it also supports importing of Postman collection(s).
If you want to find out more about client-side performance testing with LoadView, you can contact us at sales@iwconnect.com