

Introduction
BlazeMeter has an intuitive UI to create tests or reuse existing scripts and run them at scale as part of the continuous testing strategy. Besides creating tests, it has the ability to generate detailed reports and provide historical trends. BlazeMeter is a complete continuous testing platform that allows several test phases: Functional Testing, Mock Services, Performance Testing, and API Monitoring.
BlazeMeter gives an option for performance testing on the client-side by using the Taurus test script, by getting real metrics of the load and response time needed to render the page on the browser, and can help identify where the bottleneck issues are in the system under test. It provides an abstraction layer over JMeter, Grinder, Gatling, and even Selenium tests.
Recording Selenium Test Script
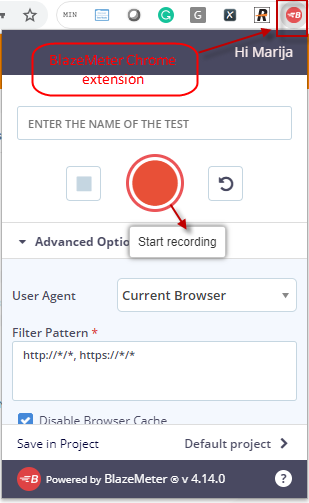
One tool for creating GUI Functional Tests in the BlazeMeter platform is BlazeMeter Chrome Extension. It is a free tool that enables recording, browsing, uploading, and running of test scripts. The Chrome Extension supports recording JMX, JSON, or YML files, for running in JMeter, Taurus, or BlazeMeter as well as both JMeter and Selenium scripts, automatically and simultaneously. There is no need to install JMeter or Selenium to record or run a performance test; the Chrome extension creates the script on its own.
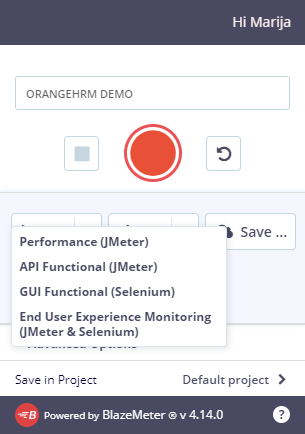
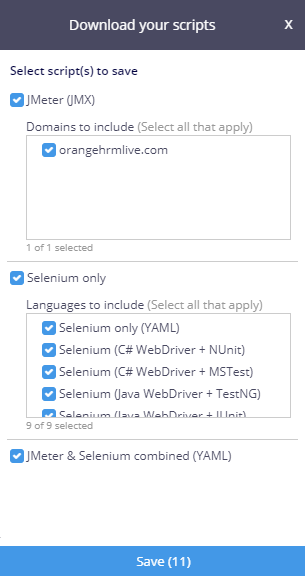
Once the Chrome extension is added it is ready to record a script by clicking the Record button. The recorded script can be saved as JMeter (jmx), Selenium (cs, java, rb, xml, py), or Combined JMeter+Selenium Taurus script (yaml). The script can be also run from the recorder directly in the BlazeMeter cloud as a Performance (JMeter), API Functional (JMeter), GUI Functional (Selenium), or as End User Experience Monitoring (JMeter & Selenium) test.
The recorded script can be also edited in BlazeMeter.
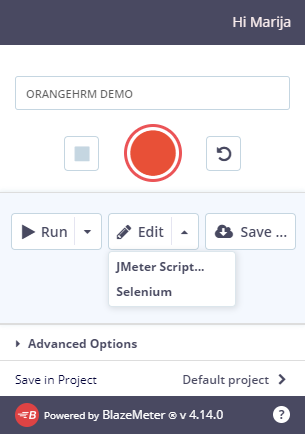
(Image 2 – Edit and Run options in BlazeMeter Chrome Extension)
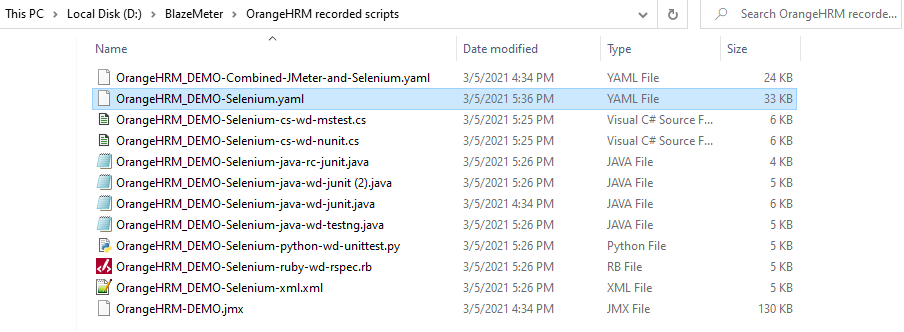
The folder where all possible types of this scenario are saved is looking like the following:
Executing test scripts on BlazeMeter
As we can see in Figure 2 there is no possibility of running the Selenium script as a Performance test through the BlazeMeter recorder. But, there is a possibility to run a combined JMeter + Selenium test as End User Experience Monitoring which means that the load will be configured on JMeter script and Selenium will be run in the background in order to collect metrics on how the browser responds on rendering external files as java scripts, images, css, etc. while the test is running via Taurus.
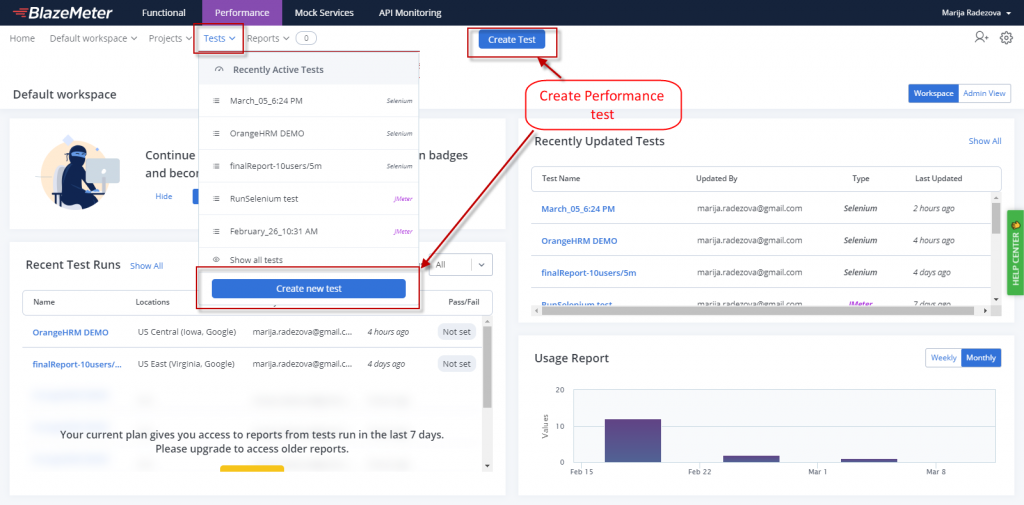
In order to run a Performance Test from BlazeMeter GUI, we choose to create a Test by clicking the blue button “Create Test” on the top of the Home Page or by selecting the Tests menu.
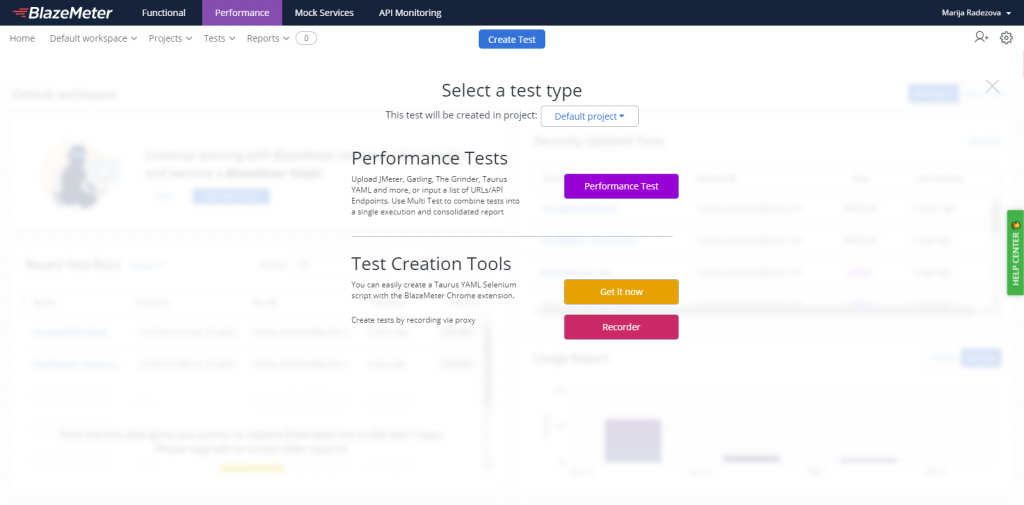
On the next screen (Image 5), we will choose the Performance Test assuming that we already recorded the script as explained above with the desired scenario.
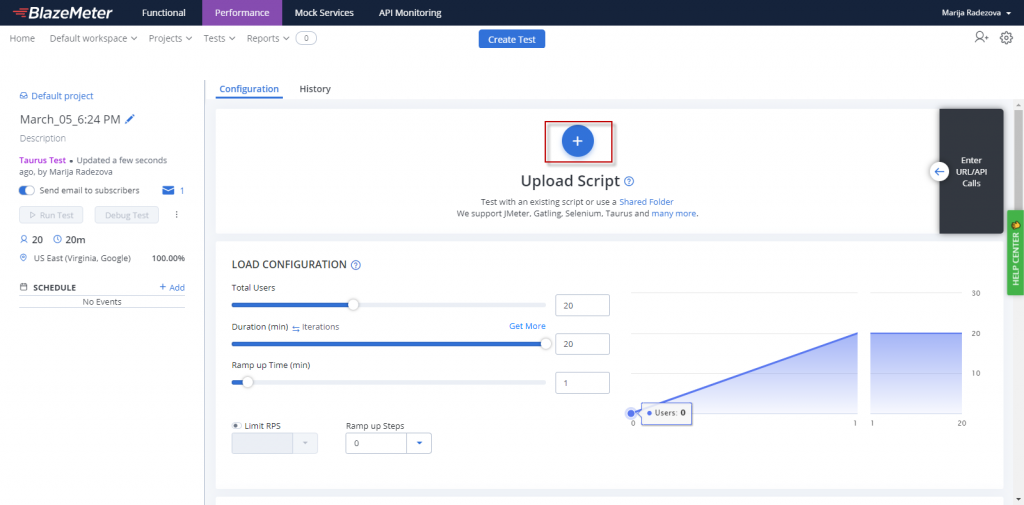
While choosing Performance Test, on the next screen we can upload a script or enter URL/API Calls for a no-scripting option (Image 6).
By uploading the YAML file, some options disappear from the UI as a result – such as Load Configuration and Load Distribution options and these settings must be configured directly via the YAML.
So in order to configure the load test parameters in the Taurus Selenium file, we need to set concurrency (number of target concurrent virtual users), ramp-up (ramp-up time to reach target concurrency), and hold-for (time to hold target concurrency) parameters in execution section in Taurus yaml file. Those parameters are not set up in the selenium sample script that we saved from the BlazeMeter Chrome Extension recorder.
For running Selenium tests on BlazeMeter, it is recommended to start with a maximum of 5 users per engine, then adjust accordingly as resources allow (which can be monitored via the Engine Health tab of the test report).
The sample scenario that we recorded and saved as OrangeHRM_DEMO-Selenium.yaml, consists of several clicks on the free testing site OrangeHRM. We will group the selenium actions in several labels, such as:
- “OrangeHRM” Login page
- Login with EES User
- Navigate to My Timesheets Page
- Add Activity
- Remove Activity
- Add missing parameters in the execution section for load configuration
We can edit the script when uploaded in BlazeMeter as in Image 7 or in an external text editor before uploading.
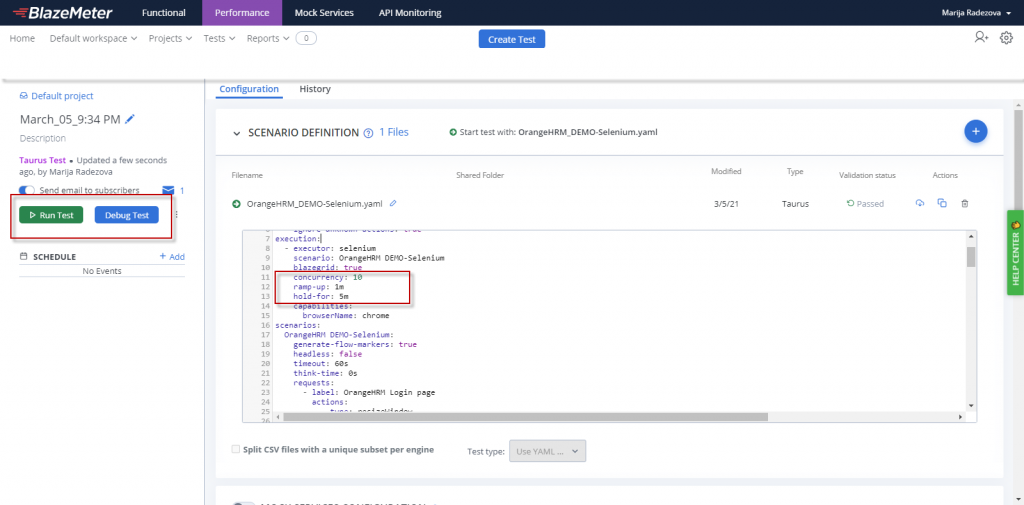
We can add additional browsers into the test by adding one more executor (e.g. browserName: firefox) to the [execution] section. Also, we can use the script parameter where we can refer to Java/C#/Ruby/Python external Selenium file instead of writing the selenium actions in the configuration YAML file.
We can check the run of the script by running Debug mode (1 user on 1 engine) and if everything runs smoothly we can run the real test by clicking the green “Run Test” button (Image 7).
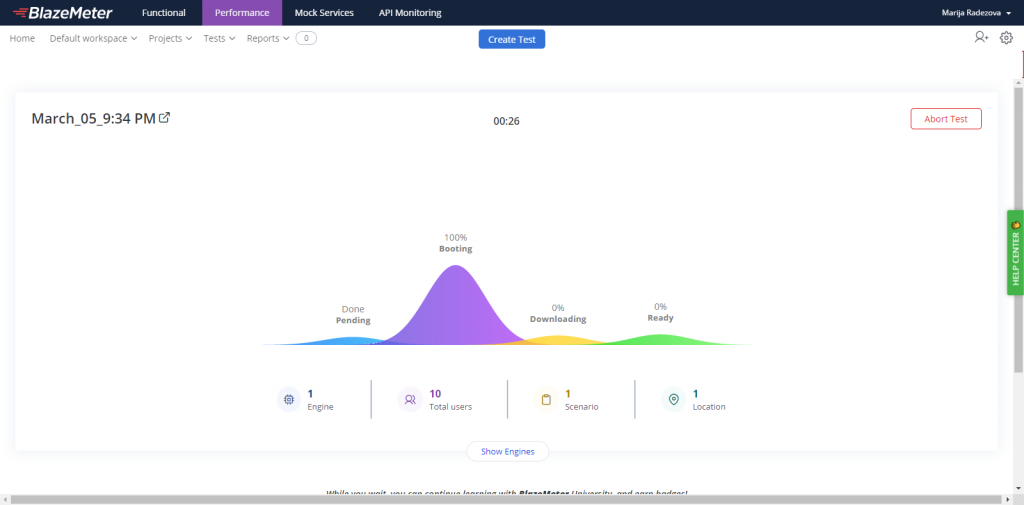
Once the test is started, it needs some time to warm up the engines and after that, the result metrics are shown below in the next section, in real-time – while the test is running. In the end, a report is generated in the history of Reports and we can find it in the Report menu with the name given at the start.
Viewing the results in BlazeMeter rich report platform
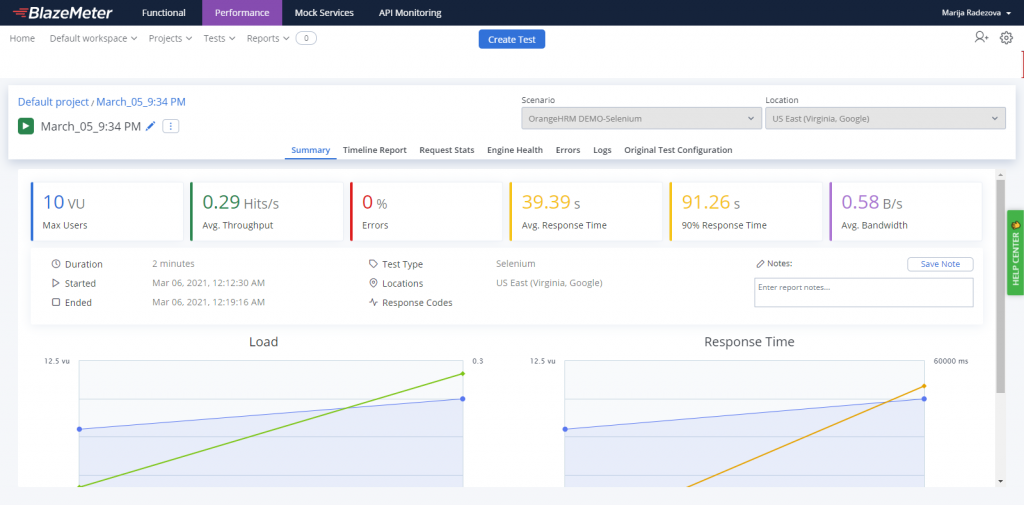
The Summary Report screen consists of general info of the test run and its metrics at the time while the test was running. The main stat panels are showing:
- Max Users (Maximum number of concurrent users generated at any given point in the test run)
- Average Throughput (Hits/s) (The average number of HTTP/s requests per second)
- Errors Rate (the ratio in the percentage of bad responses out of all responses received)
- Average Response Time (the average amount of time from the first bit sent to the network card to the last byte received by the client)
- 90 % Response Time (the response time of 90% of all requests)
- Average Bandwidth (B/s) (The average bandwidth consumption)
The second half of the screen is showing:
- Info for the duration of the test
- Start time – when the test is started
- End time – only shown when the test is ended
- Test type of the test (Selenium, JMeter, Combined as “Selenium, JMeter”)
- Locations (where is the engine located)
- Response Codes received during the test
- Editable panel for writing a Note
- Graph representations of Load and Response Time
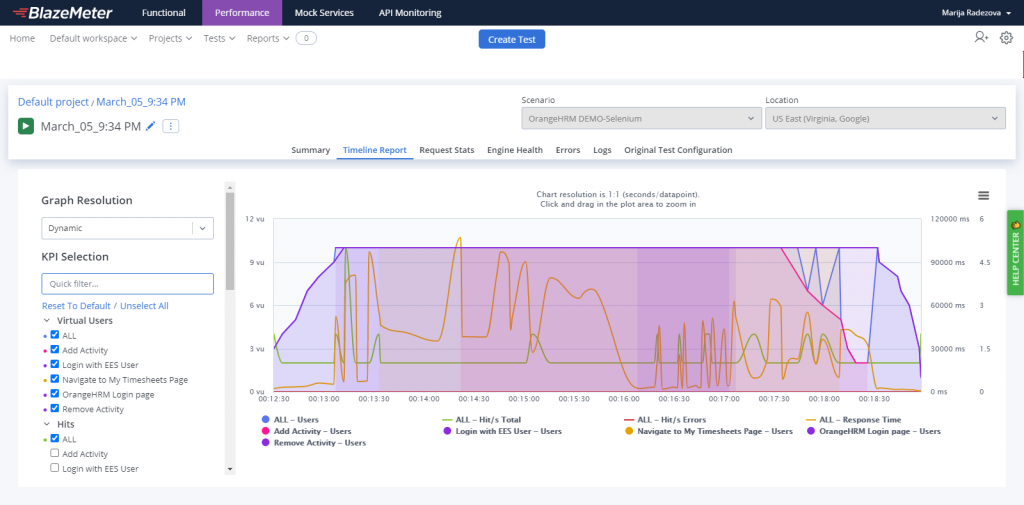
The advantage of the Timeline report is that it enables a view of many different types (Users, Hits, Errors, Response Time, Latency Time, Bytes, Response Codes) of KPIs (key performance indicators) within one graph per label. That is how we can easily visualize certain events that might have occurred throughout the test.
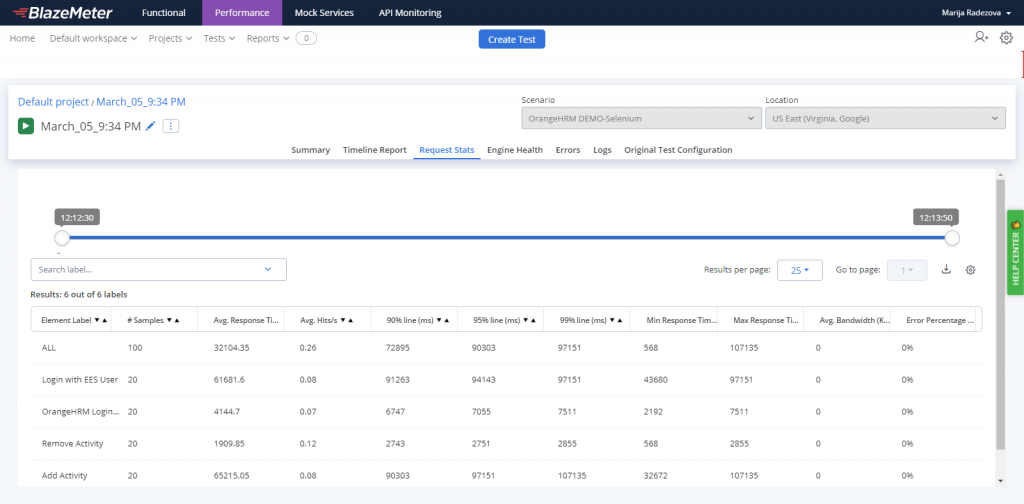
The Request Stats Report, similar to the Aggregate Report in JMeter, shows the Key Performance Indicators (KPIs), or metrics, for each element of a test script. The report can be configured by selecting only specific columns and downloaded as CSV.
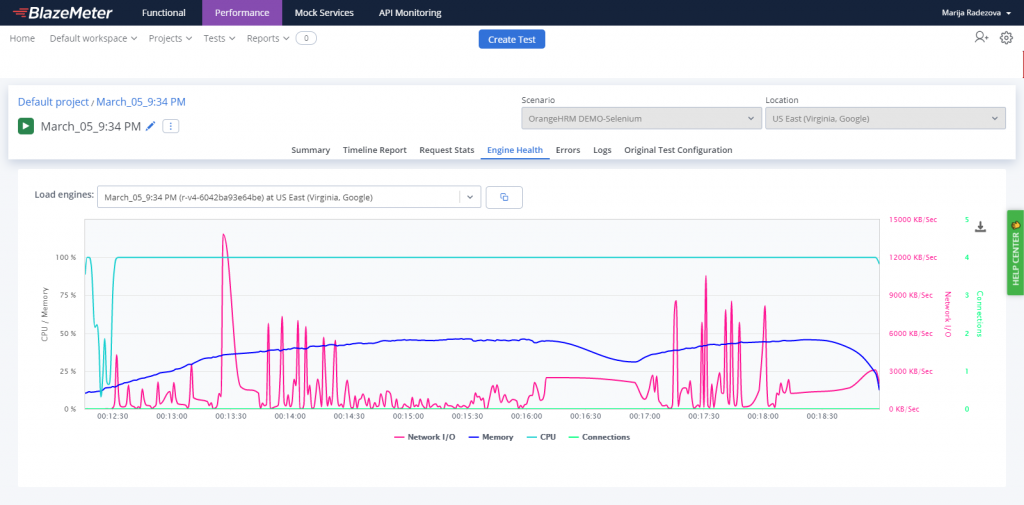
The Engine Health Report displays performance indicators received from the test engines such as Network I/O, Memory, CPU, and Connections and it is a great resource when deciding how many virtual users (VUs) each engine can support. While running a test, make sure the CPU values are lower than 80% and memory levels are less than 70%.
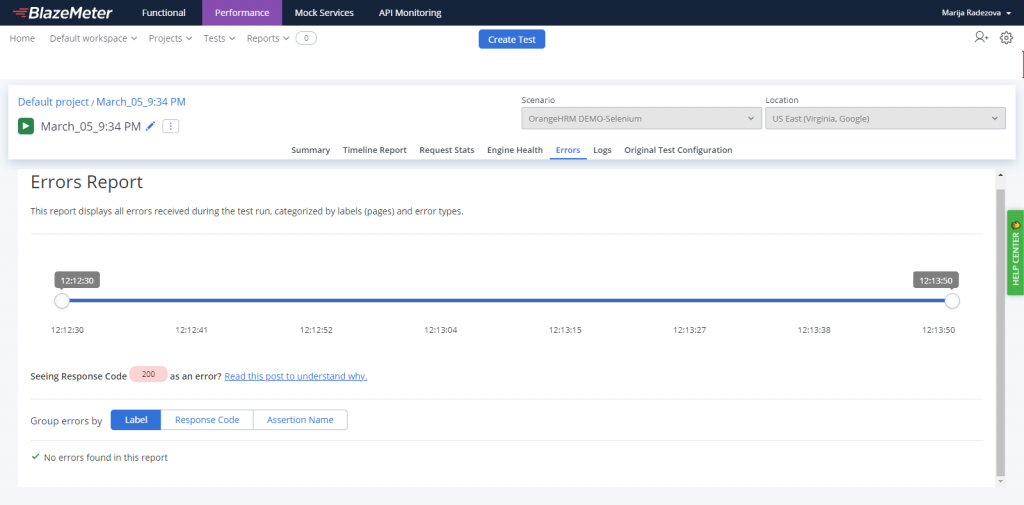
The Errors tab contains the errors that were received by the web server under the test as a result of the HTTP request. For each error, it will be displayed the response code, Response message, and Number of failed requests.
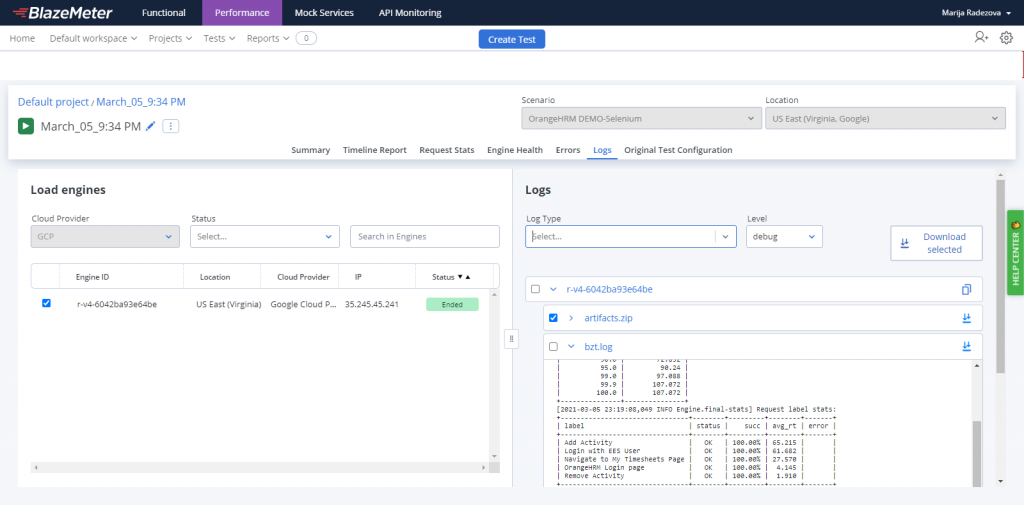
We can view and monitor the logs of each engine used during the test run via the Logs Reports, and thus ensure full test transparency. After running a test we can download logs and search for text in the logs of all engines, and quickly identify which engines don’t have artifacts (Taurus collects all test files in an artifacts directory). Besides the artifacts zipped directory we can download Taurus’s command-line tool log which is called “bzt”. Also, System and JMeter Log files are available for viewing and download.
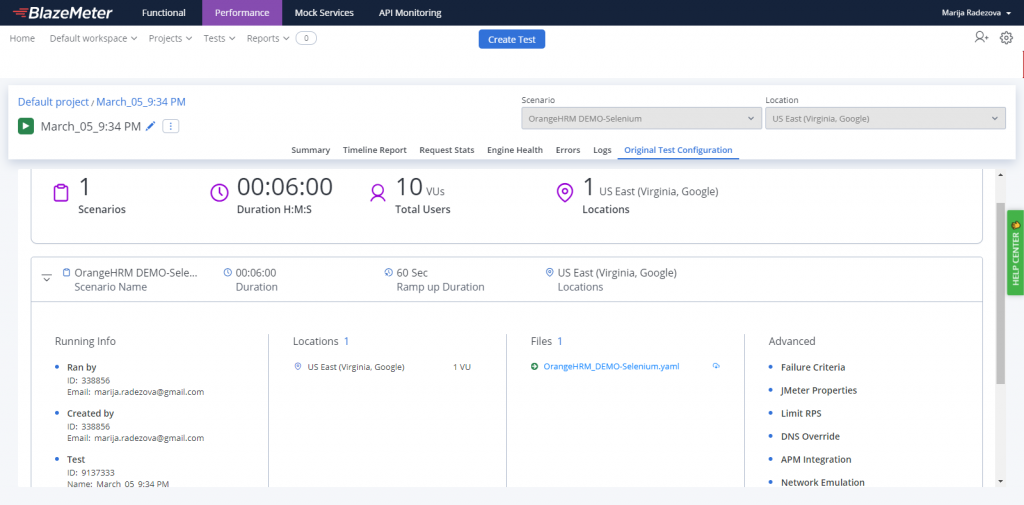
The Original Test Configuration tab shows details about how the test was configured. This tab is especially useful if the test configuration has been changed since the report was run, as the details will reflect the configuration prior to those updates. This section provides details on how the test was configured to run (as opposed to the other report tabs, which detail how the test actually ran).
Conclusion
Cloud testing leverages cloud computing resources and models to enable all aspects of load testing in a highly cost-effective manner. With cloud testing, we have unlimited resources at our disposal, and while performing all Performance Testing activities in the cloud we have benefit features such as real-time reporting. On BlazeMeter we can scale up and run Multiple Tests in parallel (on paid accounts) to speed up Test Cycles. BlazeMeter has the opportunity to simulate thousands or millions of virtual users from 56 locations across the globe (Asia Pacific, Europe, North and South America). It allows a choice of preferred cloud providers for Google, Azure, or AWS and AWS engineers. Taurus scripts are very easy to read, configure, and write and they support many test executors such as the Apache JMeter, Selenium, Gatling, etc. BlazeMeter provides rich reports, which can be shared externally as URLs, downloaded, or customized in the paid plan accounts.
If you want to find out more about client-side performance testing with BlazeMeter, you can contact us.