
Introduction
LoadNinja is a cloud-based load and performance testing tool for testing web applications. The advantage of using LoadNinja over other HTTP performance testing tools is that it can simulate real user actions using web browsers (each virtual user starts their own browser and they don’t affect each other). The modern applications are rich with JavaScript, CSS, and AJAX so HTTP-based performance testing tools can’t simulate real user actions and real browser functioning.
LoadNinja is platform-independent, the tests can be created and executed from the browser. The test development is fast and easy, no coding is required, and you can record the UI interactions using the LoadNinja recorder. You can also choose a different screen resolution for test recording and test execution.
LoadNinja is hosted on Amazon Web Services so you don’t need server machines for generating the load.
UI Test Creation
The test creation is fast and easy by using the LoadNinja recorder. For example, we will create a simple test on the free testing site OrangeHRM (https://orangehrm-demo-6x.orangehrmlive.com) which is rich in JS. The following steps will be covered in the test:
1. “OrangeHRM” Login page
2. Login with EES User
3. Navigate to My Timesheets Page
4. Add Activity
5. Remove Activity
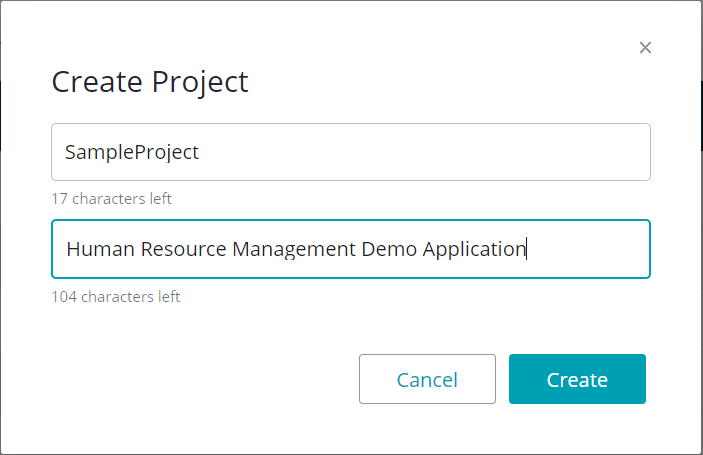
Before starting with the recording, a new Project should be created, where the tests will be located.
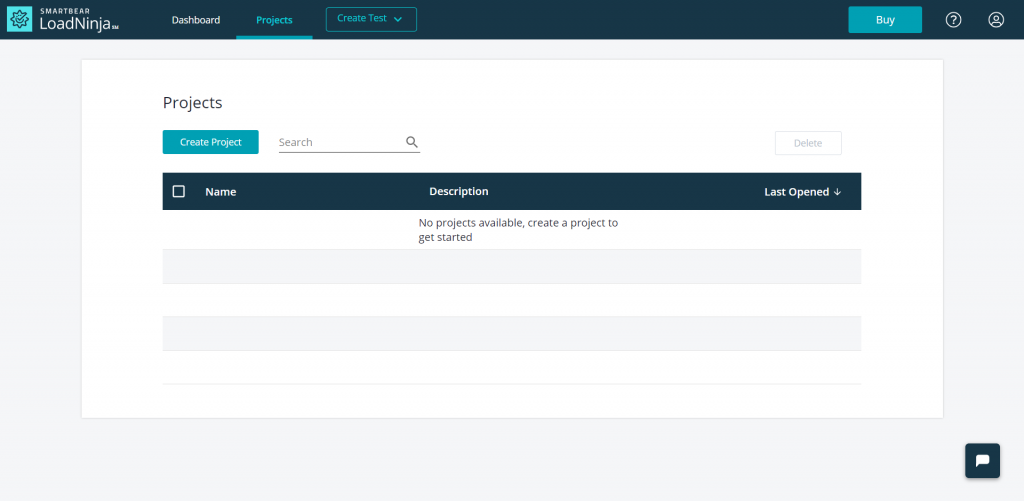
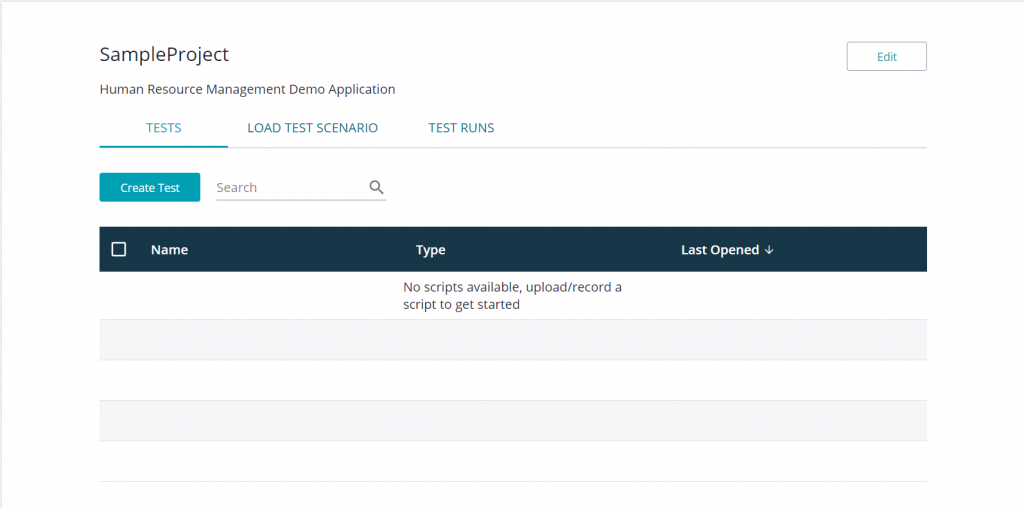
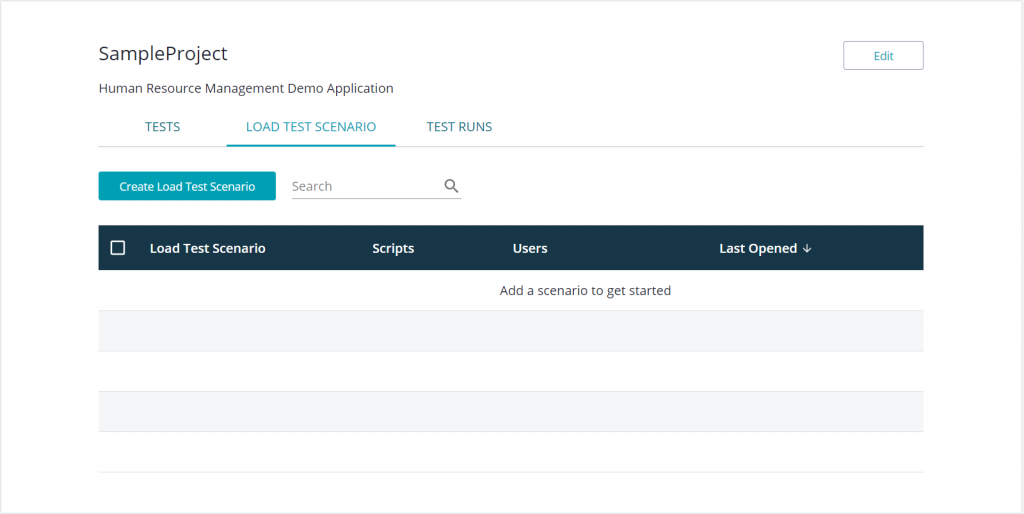
After the new Project is created it will automatically navigate to the Project page. The Project page contains 3 tabs: Tests – which contains all scripts, Load Test Scenario – all load test configurations, Test Runs – reports of the results for each load test.
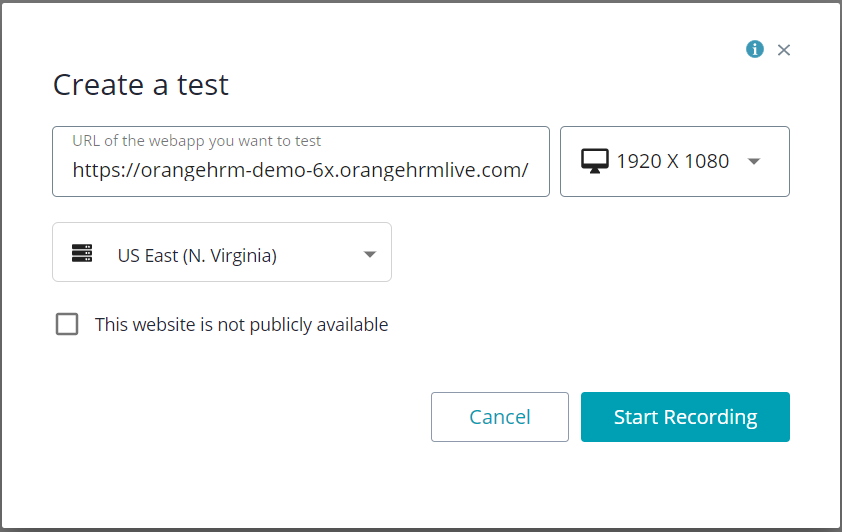
When you click on the Create Test button it will give you 2 options, UI Test and API Test. In our case, we will select UI Test. It will navigate to the LoadNinja test recorder page. In the Create Test Pop-up, you should enter the URL to the application and you can also select the screen resolution. The highest screen resolution is 1920×1080 while the lowest is 375×667. In the URL text box, add the link to the OrangeHRM application https://orangehrm-demo-6x.orangehrmlive.com/ and select display resolution of 1920×1080.
After the test is created we need to create a load test scenario from the “Load Test Scenario” tab, by clicking on the “Create Load Test Scenario” button.
It will navigate to the “Load Test Scenario – Configuration Page”. There you can set the number of concurrent virtual users and add the tests that will be executed with the load test.
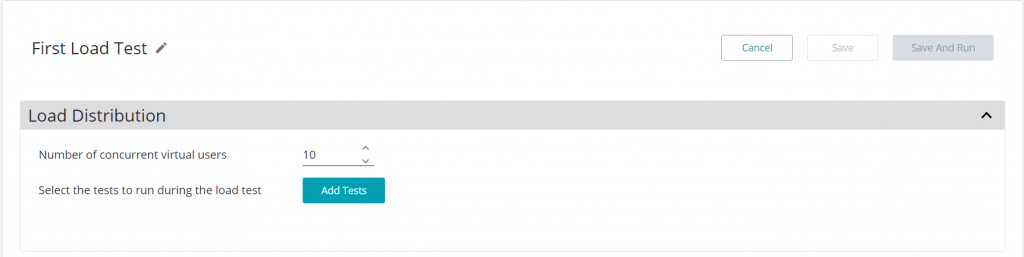
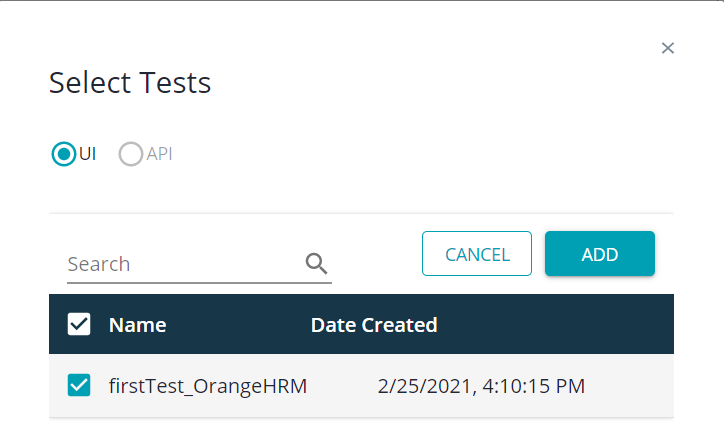
When you click on the “Add Tests” button it will display a pop-up with all the tests from the project. In this case, select “firstTest_OrangeHRM” and click on the Add button.
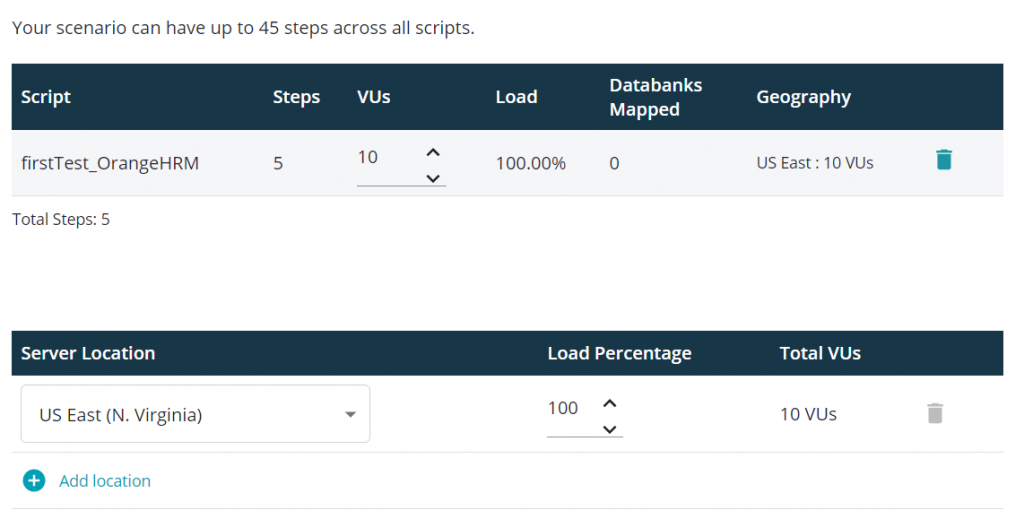
After the test is added it will display a script name, the number of steps, virtual users, etc. You can also select the server location and change the number of users. In this case, leave the default values.
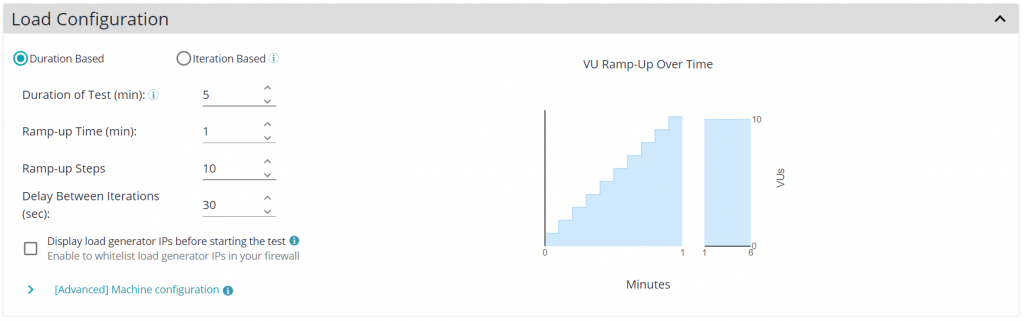
In the Load Configuration section, you can set up the load. You can choose between the “Duration Based” and “Iteration Based” tests.
In the “Duration Based” we can set the time of test run in minutes, while if we use “Iteration Based” the test will finish when each user will perform the specified number of iterations.
In this case, select the “Duration Based” option. The test will last 5 minutes with a ramp-up time of 1 minute, 10 ramp-up steps, and a delay between iterations of 30 seconds.
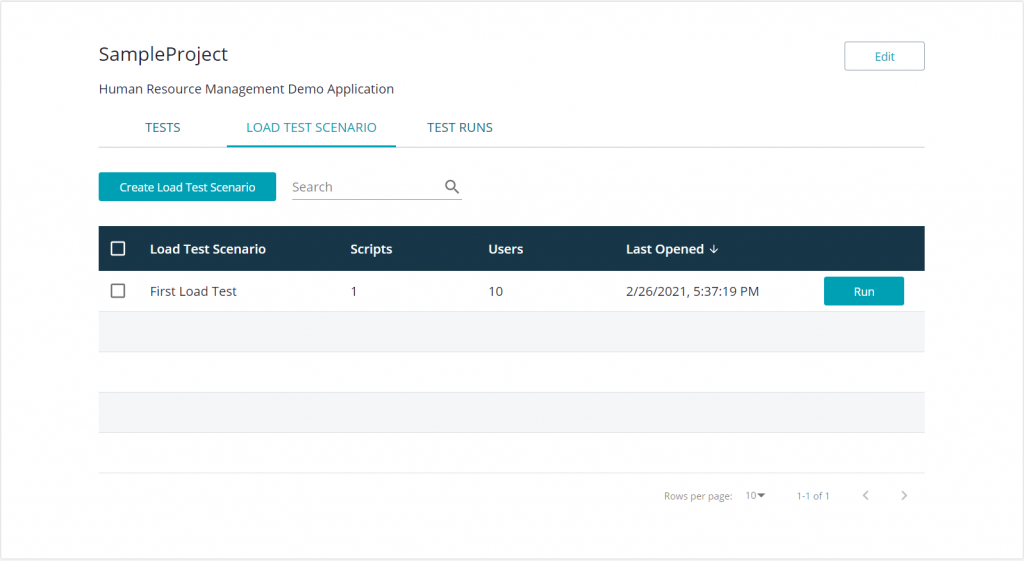
After the load configuration is set, save the load test scenario, navigate back to the Project, and in the “Load Test Scenario” you can see the scenario that you have created. Click on the “Run” button and the test will be executed.
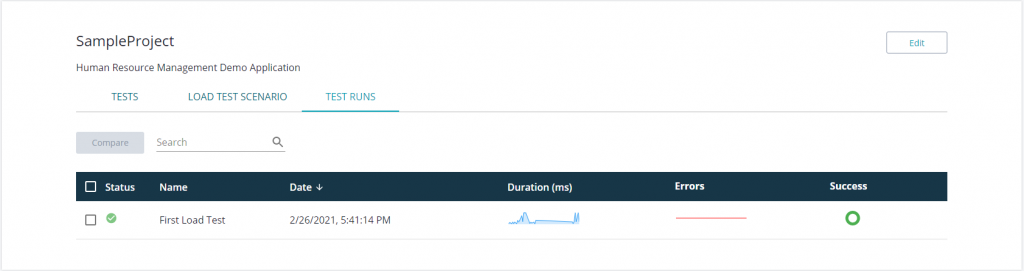
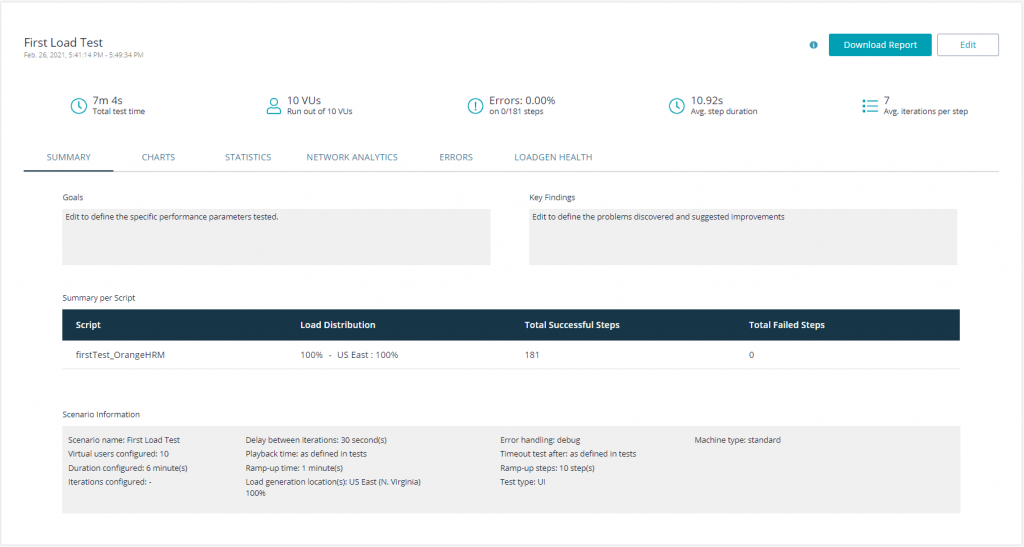
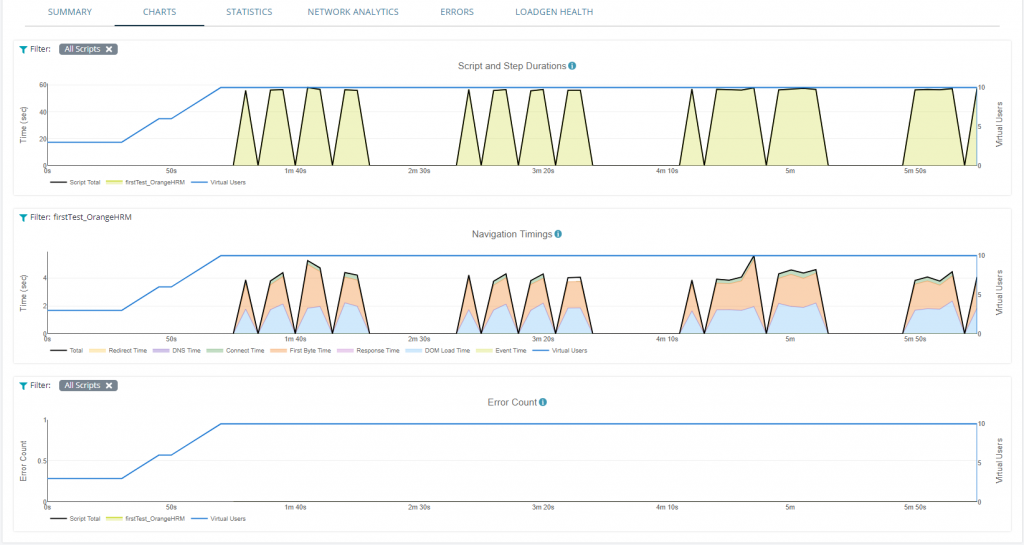
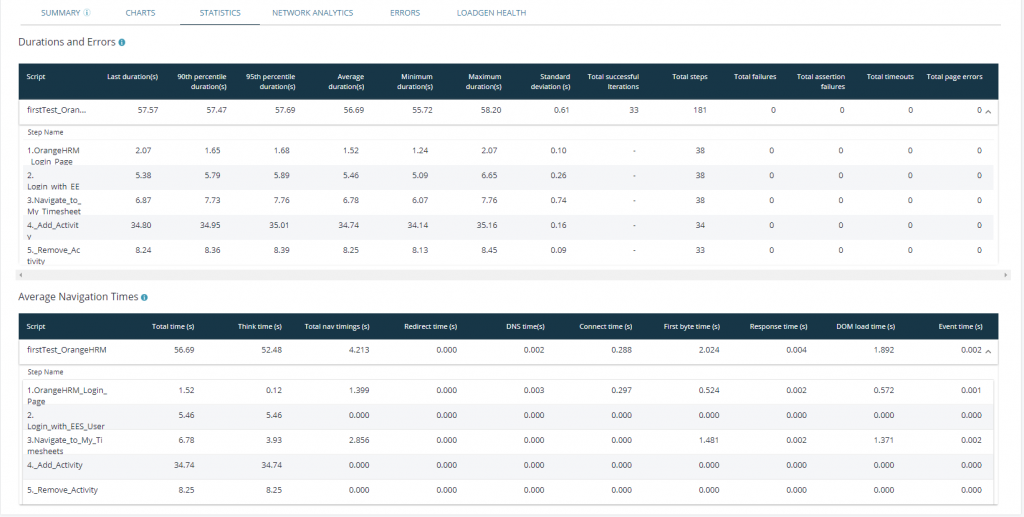
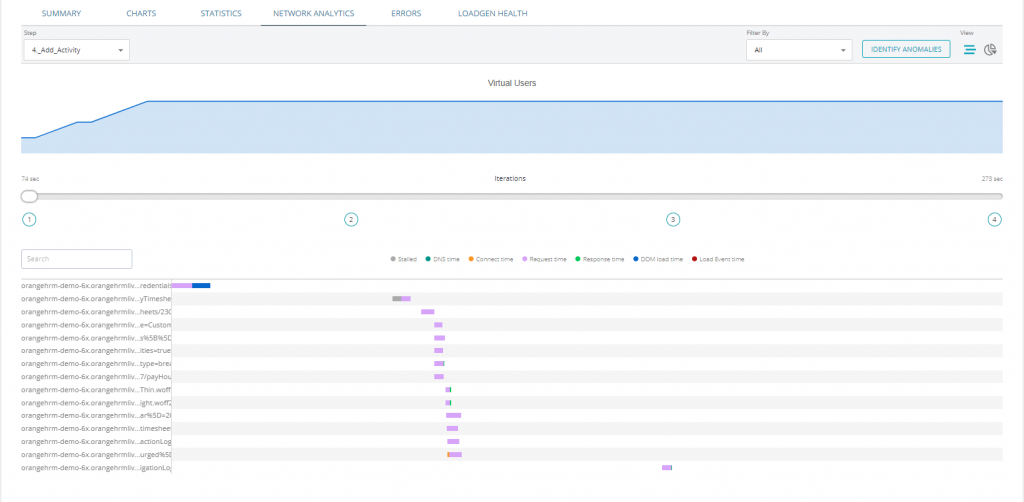
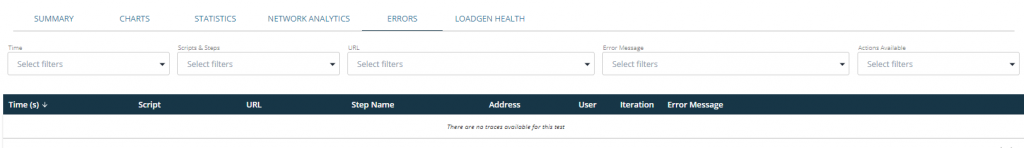
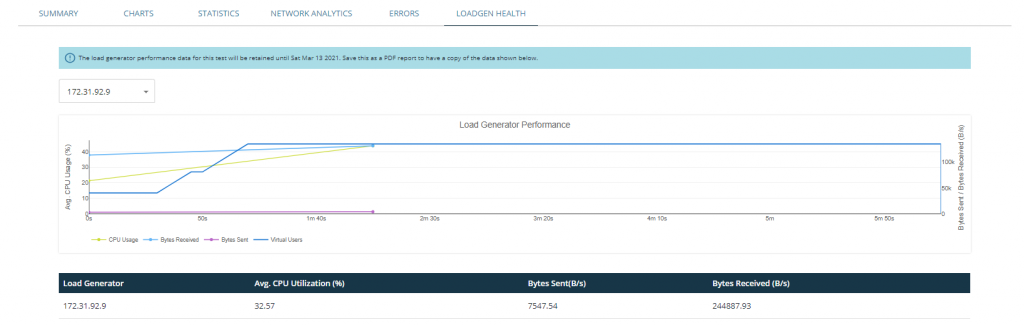
If you click on the test run tab, the report with the results of the test will be displayed, which can be downloaded in PDF, CSV, JPG and PNG format.
There are 6 tabs, Summary, Charts, Statistics, Network Analytics, Errors and Loadgen Health.
Conclusion
LoadNinja is a great load-testing tool for testing applications that are rich with JS, CSS, etc. simulating real user actions using browsers. LoadNinja uses AWS servers as load generators so you don’t need physical machines.
If you want to learn more about client-side performance testing with LoadNinja, contact us at sales@iwconnect.com.