
In one of our projects, we have exposed a set of microservices via APIGateway available for consumption. We use the Lambda function (serverless architecture) in the backend.
In our scenario, several API Resources are under one API and use the same Custom Authorizer. As Custom Authorizer, we are using the Lambda function that authenticates the user and authorizes the user to access a selected resource (based on the previous set of privileges). If the user is allowed to access the selected resource, API Gateway proceeds to invoke the Lambda function with the request sent by the user.
As a typical Lambda-based application, the main business logic consists of one or more functions triggered by events such as object uploads to Amazon S3, Amazon SNS notifications, and API actions. Once triggered, those functions usually call downstream resources such as an on-premise database, 3-rd party systems, and other AWS services, or make other API calls. AWS Lambda leverages Amazon CloudWatch to automatically emit metrics and logs for all function invocations. However, this mechanism might not be convenient for tracing the event source that invoked the Lambda function, or for tracing downstream calls that function has made. All in all, we have one distributed application using a microservices architecture and when it comes to performance, tracing, and monitoring activities, we need to use different tools in order to catch all different distributed entities that form the system Until AWS X-Ray service.
AWS X-Ray
AWS X-Ray service was introduced at Re:Invent conference held in December 2016. AWS X-Ray helps developers analyze and debug distributed applications such as those built using a microservices architecture. It quickly enables developers to discover application bottlenecks or issues and improve the performance of their applications. X-Ray provides an end-to-end view of requests as they travel through the application and the underlying components. This helps to troubleshoot the root cause of performance issues and errors and shows how an application and its underlying services are performing.
How it works
AWS X-Ray daemon process works in conjunction with the AWS X-Ray SDKs and listens for traffic on the UDP port, gathers raw segment data, and relays it to the AWS X-Ray API. When the application makes calls to AWS services to store data, write to a queue, or send notifications, the X-Ray SDK for Node.js tracks the calls downstream in sub-segments. Traced AWS services, and resources that were accessed within those services (for example, an Amazon PostgreSQL database or Amazon SNS), appear as downstream nodes on the service map in the X-Ray console.
When tracing, the X-Ray daemon consumes a maximum of three percent of the function’s memory allocation. For example, if the Lambda function allocates 128 MB of memory, the X-Ray daemon has 16 MB of the function’s memory allocation. If the function allocates 1024 MB, the X-Ray daemon has 31 MB allocated to it (3 percent).
Out-of-memory error?
Lambda will try to terminate the X-Ray daemon to avoid exceeding the Lambda function’s memory limit. For example, assume Lambda has allocated 128 MB, which means the X-Ray daemon will have 16 MB allocated to it. That leaves the Lambda function with a memory allocation of 112 MB. However, if the function exceeds 112 MB, the X-Ray daemon will be terminated to avoid throwing an out-of-memory error.
Node.js Set up
Here are the basic steps of how we integrated X-Ray into our solution.
- First, we configured our Lambda function
- Open the AWS Lambda console.
- Choose the Lambda function.
- Choose Configuration.
- Under Advanced settings, choose Enable active tracing.
Another approach is to add a managed policy: AWSXrayWriteOnlyAccess to the Lambda role manually.
- Next, we include SDK for Lambda function monitoring on runtimes with a corresponding X-Ray SDK that will run as a daemon process.
For example, in the Lambda function that uses Node.js we include:
const AWSXRay = require('aws-xray-sdk');
const pg = AWSXRay.capturePostgres(require('pg'));- Deploy Lambda function on S3 and monitor X-Ray data under Monitoring -> View traces in X-Ray. This will open a new view where the traces for the Lambda function are listed.
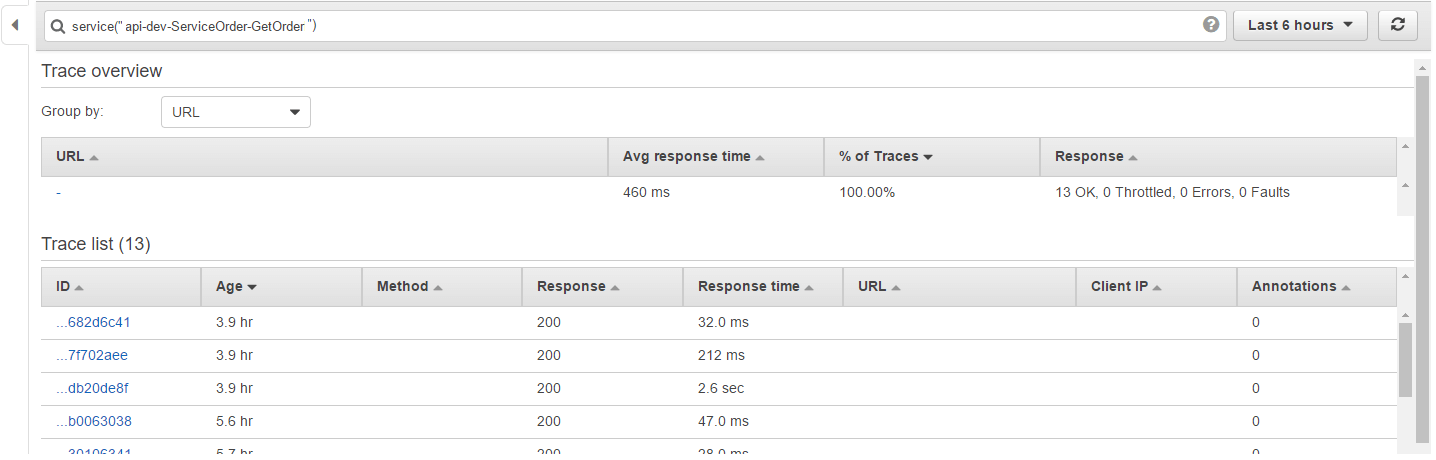
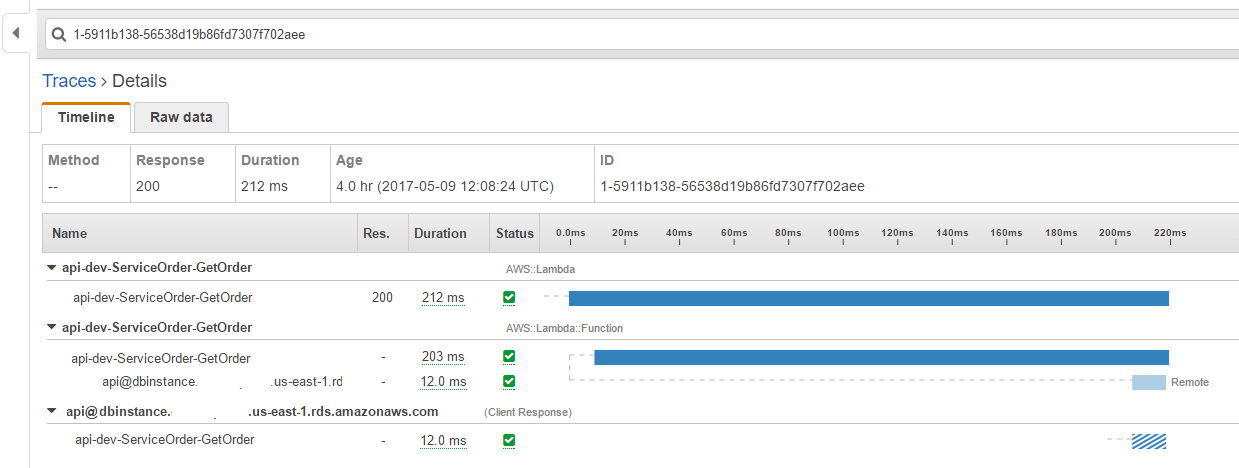
In Trace->Details more info can be found about separate underlying processes in Lambda execution.
If we go back to our API scenario, we had two Lambda functions called as part of API call execution:
- Custom authorizer
- Lambda function for Business implementation
Complete API execution can be previewed using Aws X-Ray Service Map:
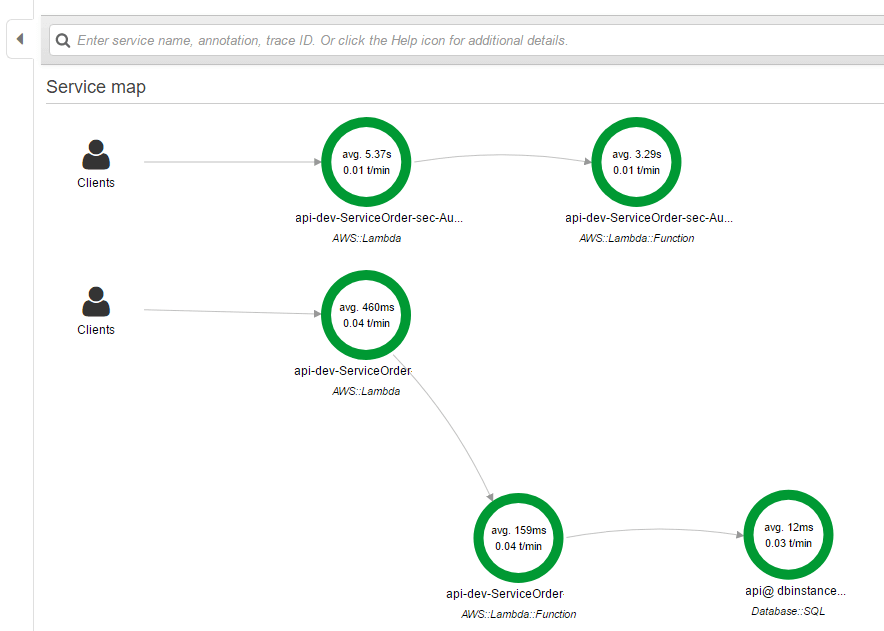
X-Ray displays three types of nodes on the service map for requests served by Lambda:
- Lambda service (AWS::Lambda) – This type of node represents the time the request spent in the Lambda service. Timing starts when Lambda first receives the request and ends when the request leaves the Lambda service.
- Lambda function (AWS::Lambda::Function) – This type of node represents the Lambda function’s execution time.
- Downstream service calls – In this type, each downstream service call from within the Lambda function is represented by a separate node.
In our scenario, this preview gives info about Lambda container initialization, Lambda function execution, and calls to the PostgreSQL database.
A great achievement of X-ray trace capture is that the trace goes deep down to all modules that depend on the captured module. In the following example, we set capture on the ‘aws-sdk’ module and we are using another module ‘aws-cwlogs’ that depends on ‘aws-sdk’ module:
const AWSXRay = require('aws-xray-sdk');
var AWS = AWSXRay.captureAWS(require('aws-sdk'));
const CwLogs = require('aws-cwlogs');
In the function, we are not calling AWS directly but instead, we are using CwLogs:
const options = {
   region: 'us-east-1',
   logGroupName: '/aws/lambda/readWorkerFunction'
};
const lambdaLogger = new CwLogs(options);
lambdaLogger.start(options);
If we open the X-Ray trace, we can see that the trace to CloudWatch Logs is presented even though we did not set tracing explicitly to CwLogs.
Conclusion
AWS X-RAY is a powerful tool that lets developers debug development/production and distribute applications, especially in the microservices architecture. X-Ray makes it easy for developers to create a service map, identify bugs and bottlenecks, and improve the application performance. The main advantage of X-Ray is that developers use One Tool for Many Applications. AWS X-Ray works with a variety of applications, from simple applications to microservices architecture-based complex ones. AWS X-Ray makes it easy for developers to trace the execution across the application or application requests across multiple AWS platforms, regions, or zones.