The management team in every company needs to understand the magnitude of the value given by the forecast. Each company needs a system to track the team’s productivity and performance especially when we are talking about the sales team.
Although we are in the 21st-century some companies still track the team’s progress and their results in time-consuming spreadsheet documents.
Daily, the management team asks questions such as:
- Is my team productive enough?
- Do they meet the target by months?
- How much time the sales reps spend selling? etc.
Having information in real-time allows you to react promptly if an unexpected situation occurs, and at the same time to monitor the quality of work of the best employees.
You can get all this and much more by using Microsoft Dynamics 365 Sales Forecast Dashboard.
Microsoft Dynamics 365 Sales hub has an out-of-the-box solution for you!
The sales team can configure the forecasting dashboard offered by the system or make custom solution configurations that do not require developer knowledge.
Today we will talk more about forecasting dashboards that have a custom revenue field and calculate within that field.
First, you need to create a custom field for example monthly revenue in Power apps, and add the field in the Opportunity form. You can use a new clone solution or patch for form changes. We can talk about the solution and patching more in a different blog. Back to our topic?
The field is created and added in the Opportunity form:

Navigate to the Sales menu – bottom left on the screen and select the App Settings then click Forecast configuration.
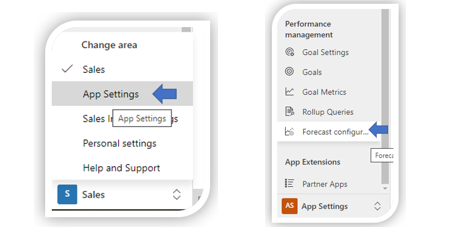
You have several types of templates: Org chart forecast, product forecast, territory forecasts, and the ability to create forecasts from scratch. We are using an org chart forecast for this purpose.

In the General step, first, you must select the Rollup entity. For Hierarchy entity in this scenario, we would like to have a hierarchy created by the user and at the end, we will use the default underlying records view – Opportunity Forecast View.
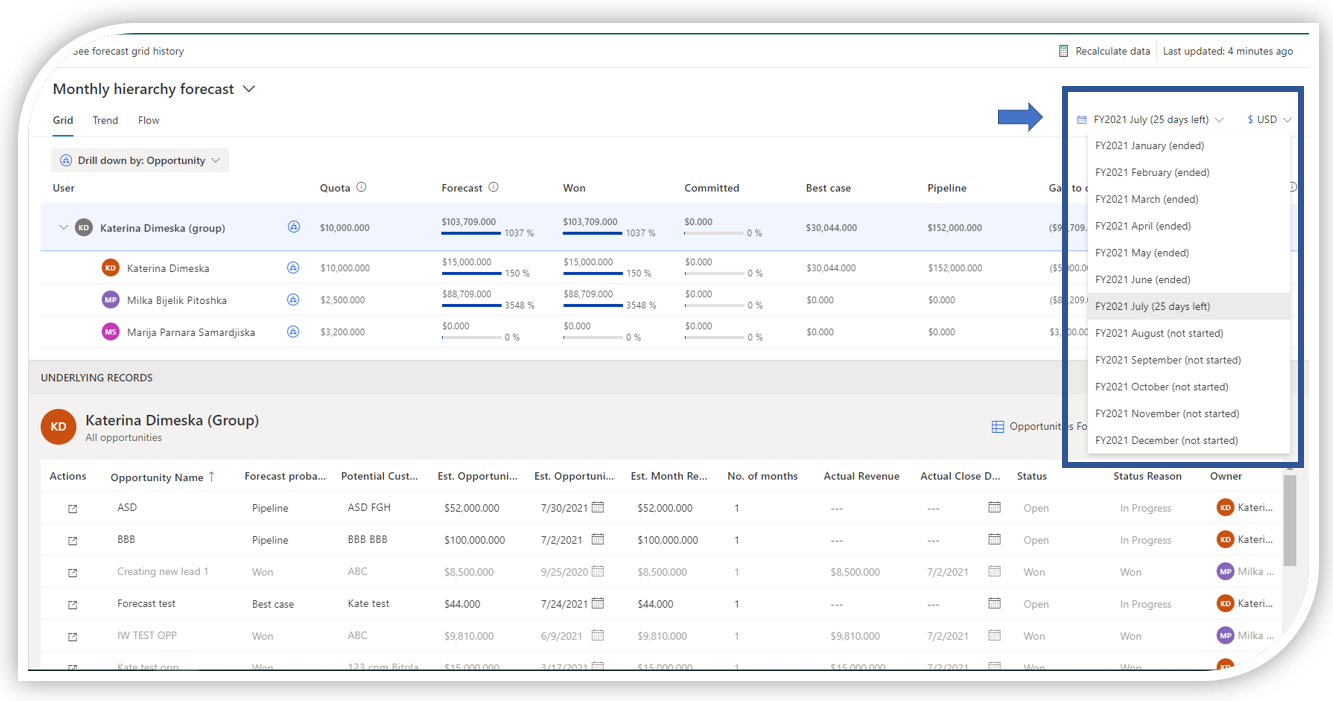
The next section for setting up is the time frame. We want to have a forecast per month so from the drop-down list select Monthly period = Month, Fiscal Year to be FY2021, Start the forecast = January, and the number of period 12- which means forecasting from January to December.
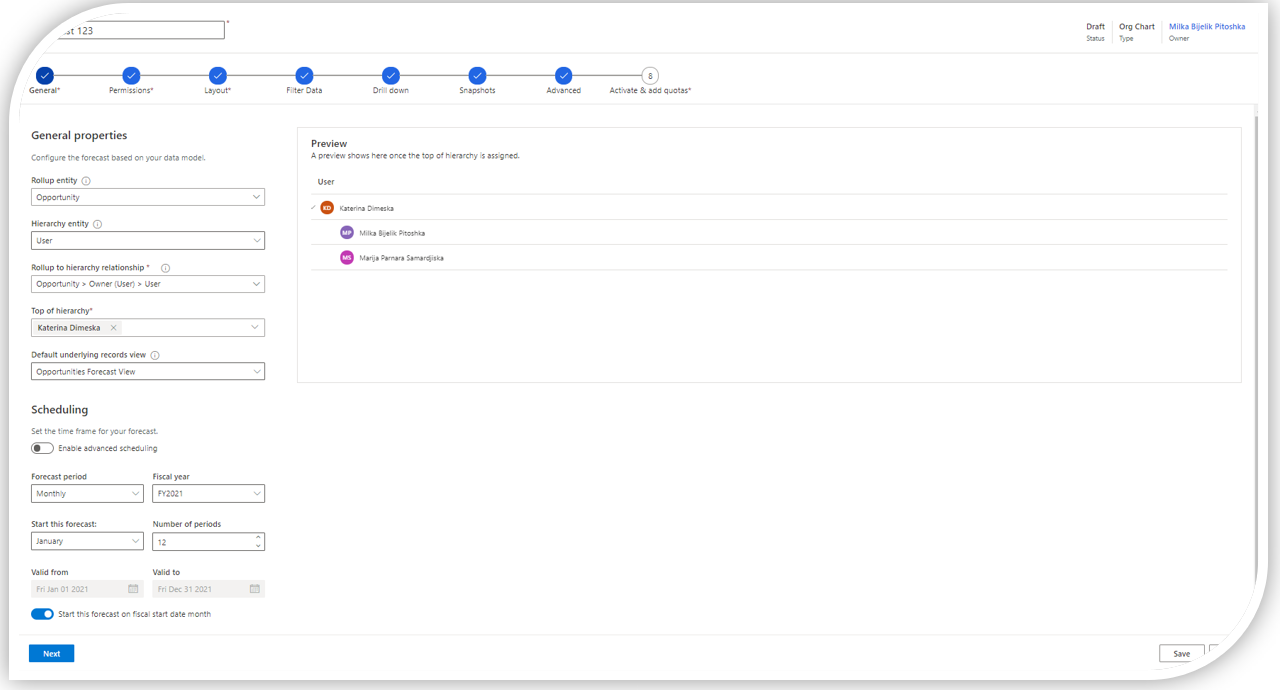
Let’s assume we will not have any restorations and settings permissions. We go to the next step and set up the layout fields. This is the main step for creating a forecast with custom-filed revenue.
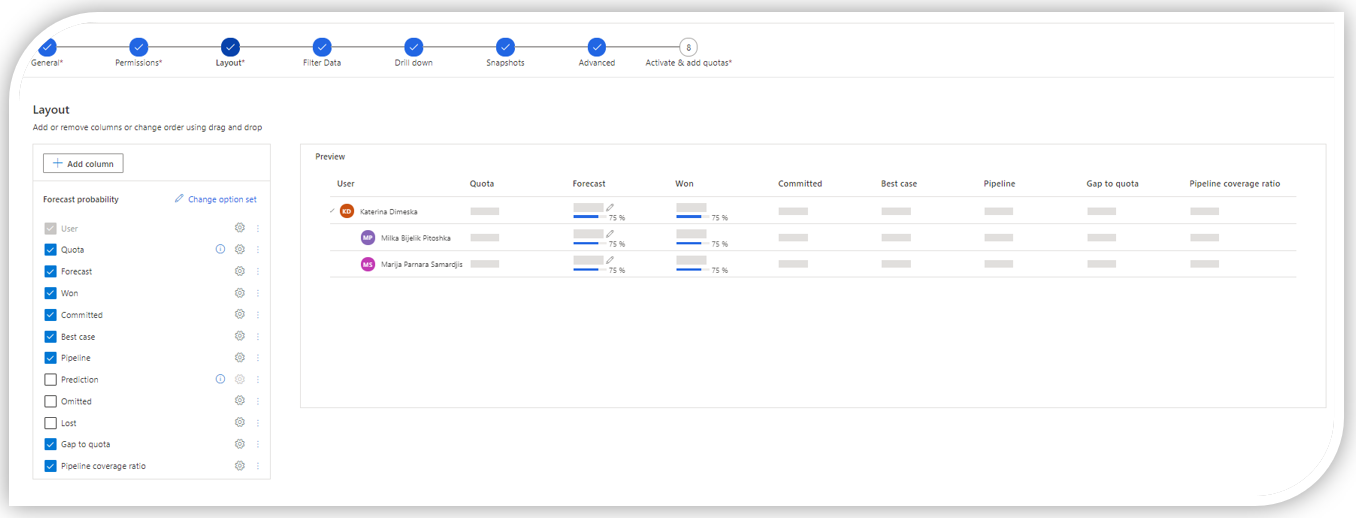
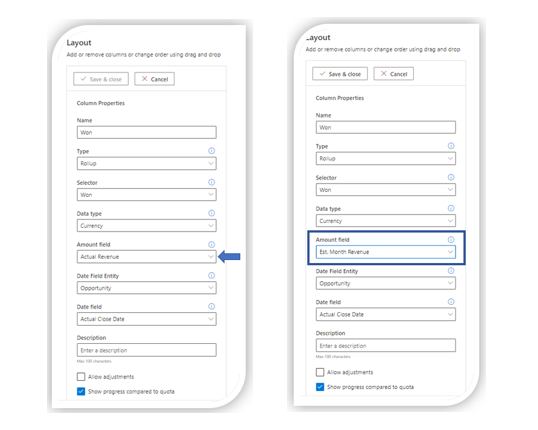
For each option, you need to reset the Amount field and select the new revenue field. You do not need to make changes in the calculation fields like Gap to quota, Forecast, Pipeline coverage ratio, etc. They are using already changed fields (est. month revenue) and the calculation will be based on that.
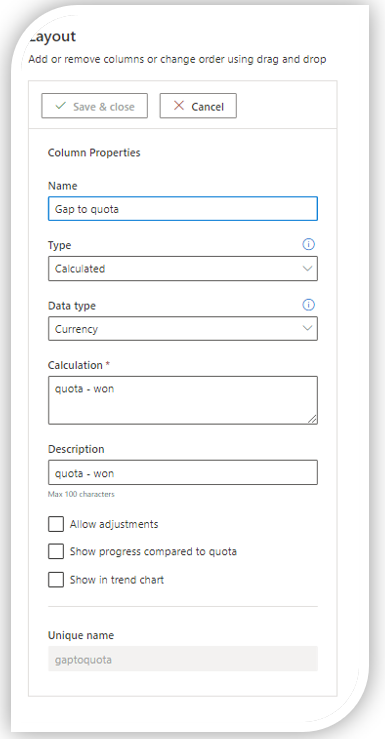
If you need to have more filters you can add them accordingly. Also, if the sales team needs to have drill down by a different entity in the next step, that is possible to configure but, in this blog, the focus is on the Layout.
The last step is to activate the forecast and to populate the predefined document with quota per user and month in our case. After making changes the creator needs to upload the same document back in Dynamics.

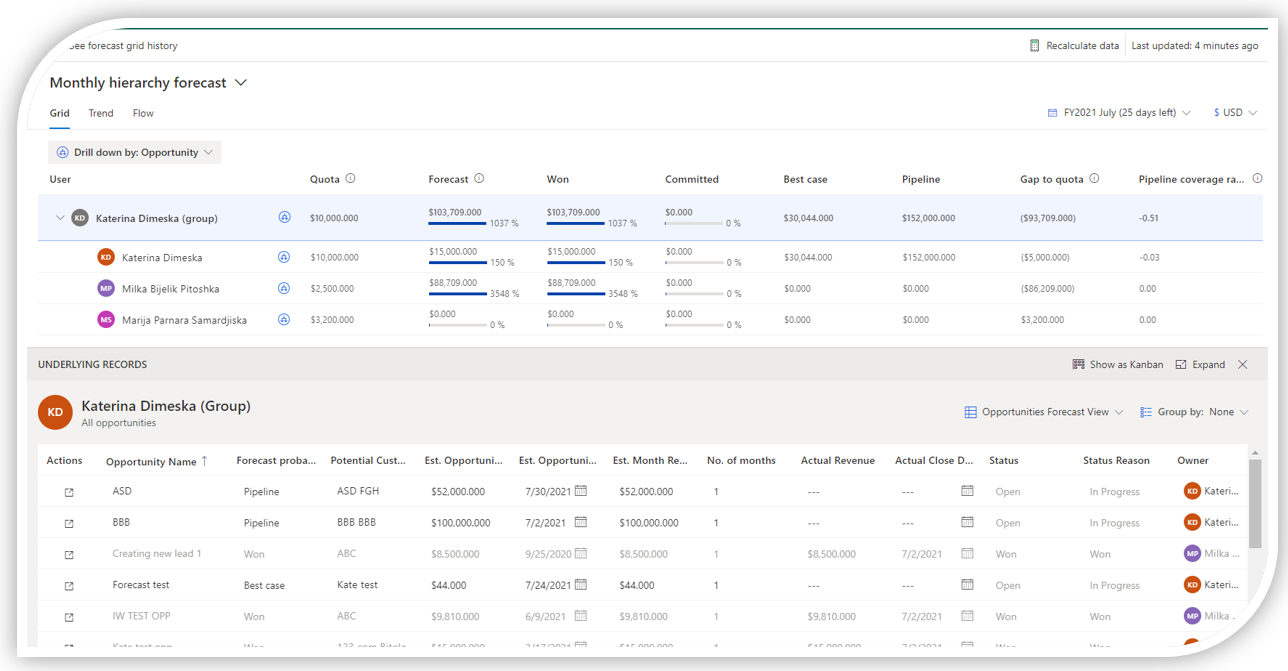
In the end, the team will have a dashboard that will look like this:
Conclusion:
I hope that the solution shown above will be useful to you and you will implement it in your Dynamics Sales Hub.
Some of the benefits you will get from implementing this solution are increased team productivity, increased transparency, and boosted sales teamwork. This kind of dashboard gives you availability regardless of the place and time and most importantly, your organization will have real-time monitoring of results.
Thank you for making it this far :).
If you need additional information feel free to contact us, and we can go into details.

