
The moment an agentic data quality pipeline starts running every day in production, the engineering problem changes shape entirely. What worked as a one-time assessment starts looking expensive, fragile, and opaque.
This is part two of our series on building the engine behind our agentic data quality platform at IWConnect. It covers what it took to move from a working proof of concept to something teams use every day.
The proof of concept worked. The pipeline enriched metadata. It ran quality checks across six dimensions in parallel. The reports gave teams real context, not just error counts.
We were happy with it. But when something works, people want to run it every day, inside their actual infrastructure. That’s when real engineering begins.
Why running it every day broke the cost model
The full pipeline isn’t too expensive but running it daily on every dataset wastes money on data that hasn’t actually changed. Most of the cost sits in the LLM-heavy steps: metadata enrichment, interpretation, report generation. On most days, that level of processing just isn’t needed.
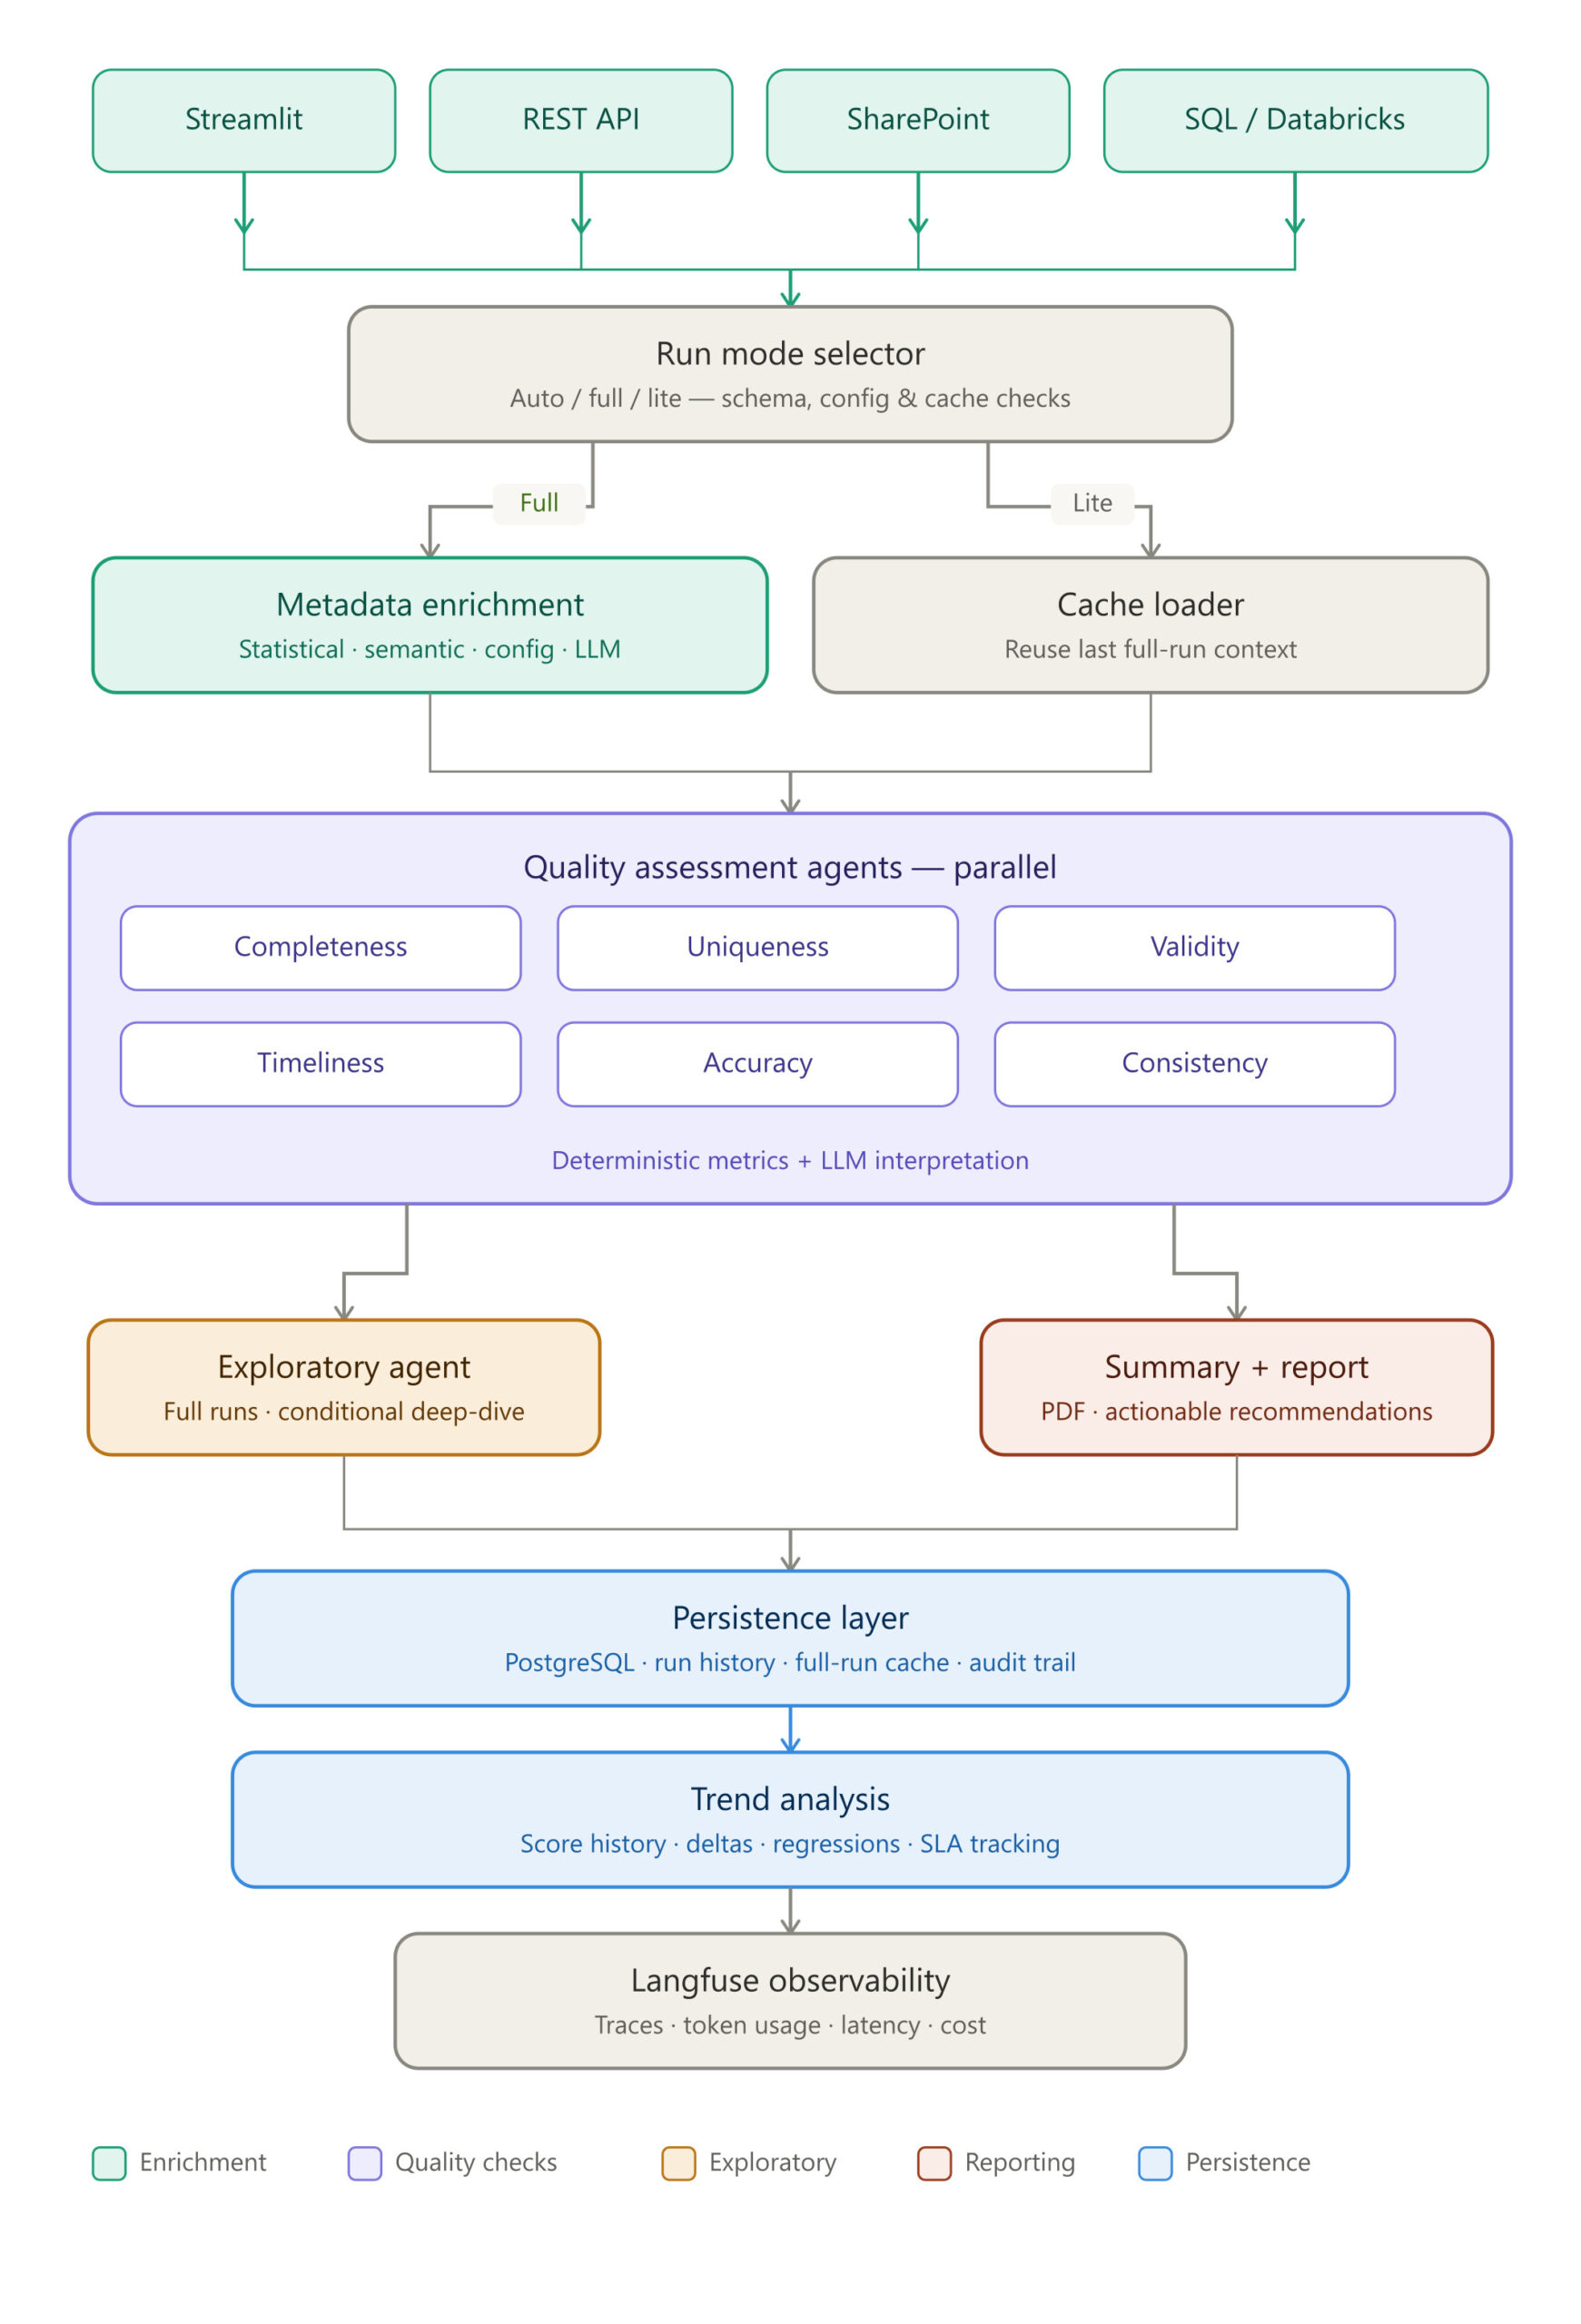
So we split the pipeline into modes. A full run does everything: semantic enrichment, interpretive layers on the quality agents, deeper analysis when the data warrants it, full reporting. A lite run reuses the context from the last successful full run.
Deterministic metrics still recompute every run: completeness rates, duplicate signals, validity flags, timeliness checks. Only the expensive interpretation steps get skipped. Reports flag which mode produced them, so nobody mistakes a monitoring pass for a full audit.
There’s also an auto mode that decides for you. It looks at how much has shifted since the last full run: time elapsed, schema changes, configuration updates, cache age. If something significant has changed, it triggers a refresh. If not, it doesn’t.
The result is meaningful quality monitoring every day, without treating every run like a research project.
What changes when you watch quality over time
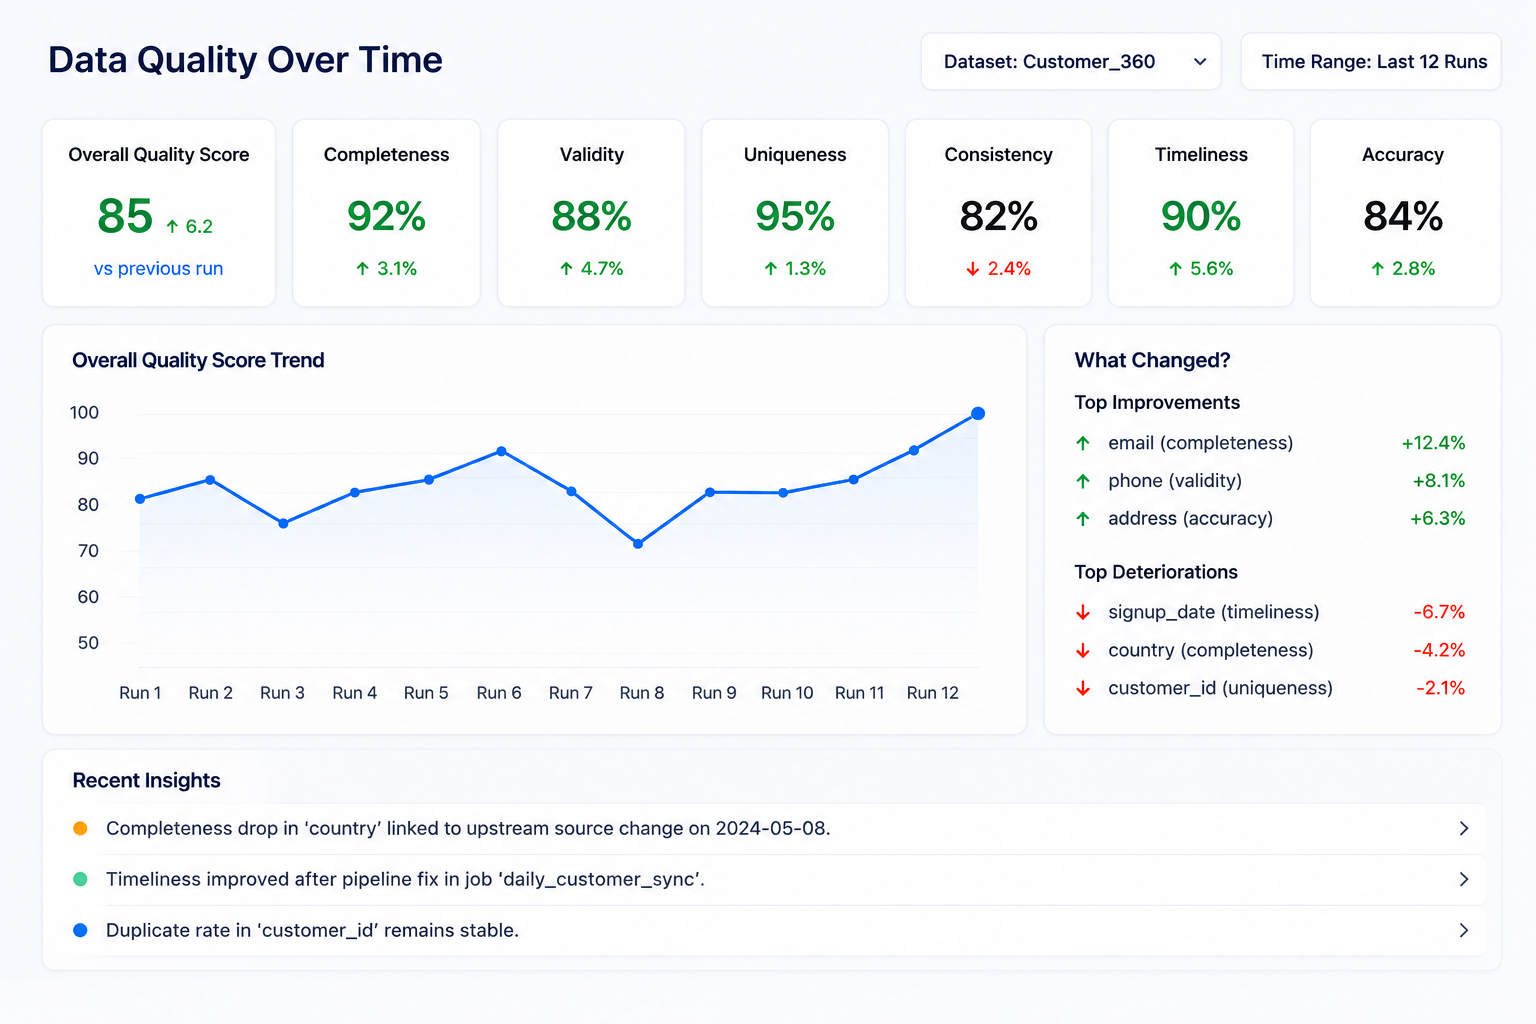
Once a pipeline runs on a schedule, a single quality score stops being the interesting number. What matters is whether things are getting better or worse, whether a fix actually held, whether a dataset is quietly degrading before anyone notices. So, each run now captures its full context: metrics, metadata, findings, configuration.
But storing numbers isn’t enough. The more useful question isn’t “what’s the score today.” It’s “why did it change.”
Trend analysis surfaces what actually moved between runs. Which columns improved and why. Which issues are recurring versus one-off. Where something that looked fixed has quietly come back.
A completeness drop on a key column gets connected to what changed upstream. A validity improvement after a pipeline fix gets recorded with the context that explains it.
Over time, this builds something more valuable than a dashboard. It’s a record of how your data has evolved, what interventions worked, and where the same problems keep coming back in different forms. The kind of institutional memory that usually lives in someone’s head or doesn’t exist at all.
Meeting data where it lives
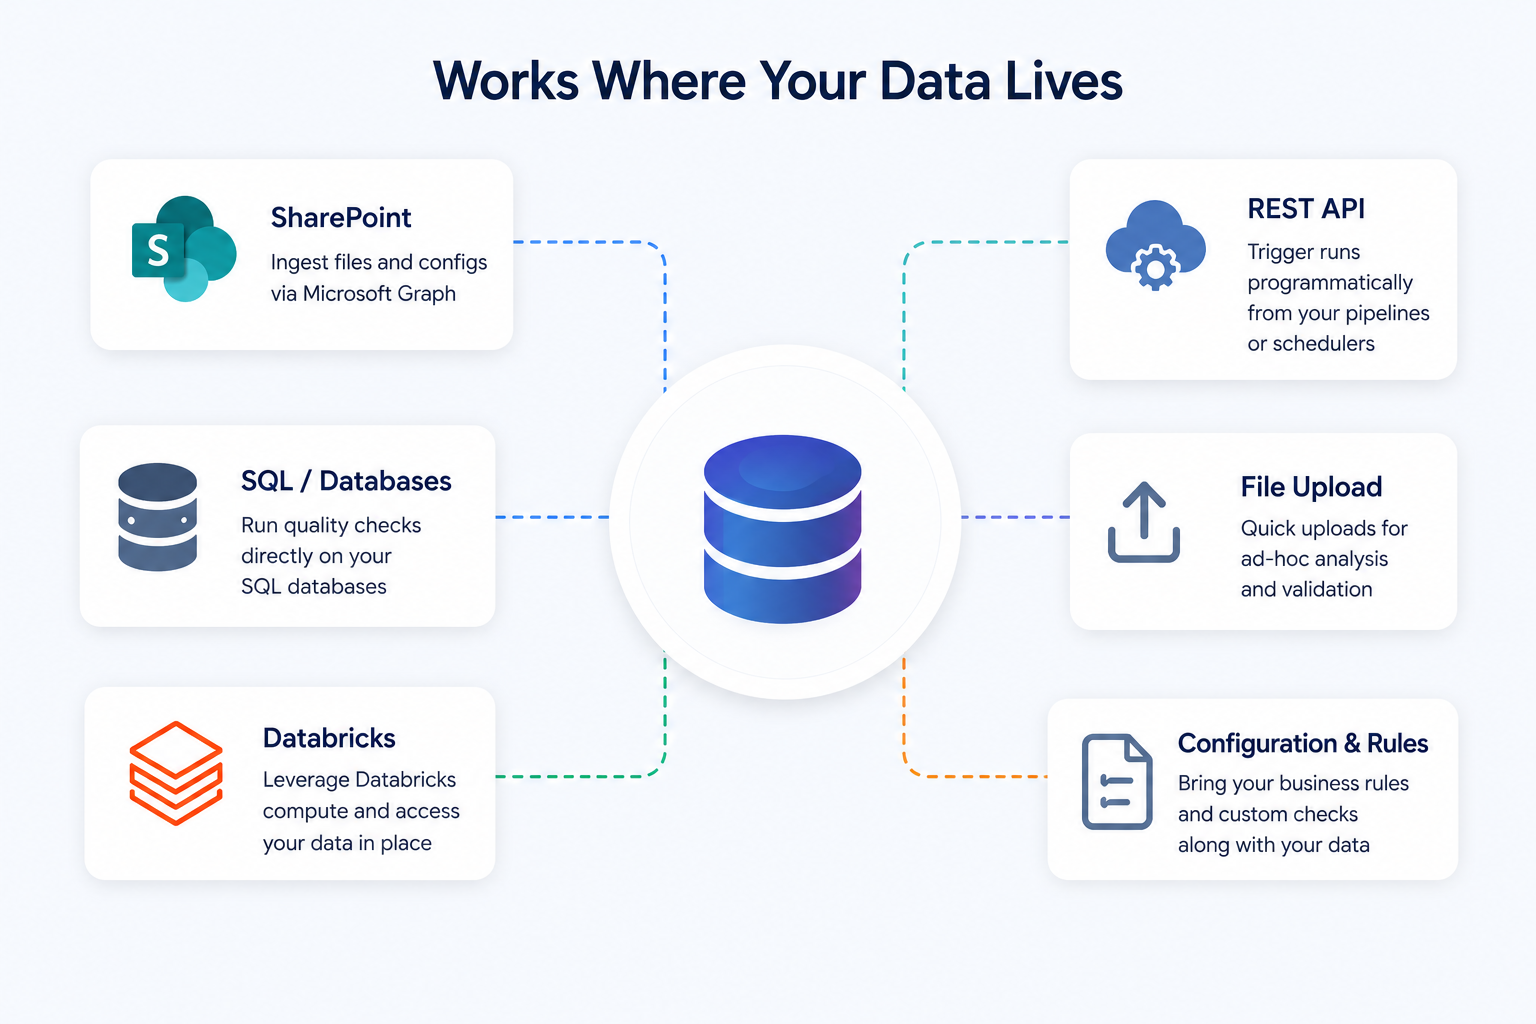
Different teams live in different environments and forcing them to export data just to check its quality is already a failure mode. Some teams work out of SharePoint. Others run directly on SQL databases or Databricks. The tool adapts to where the data is, not the other way around.
SharePoint ingestion pulls CSV or Excel files straight from a library through Microsoft Graph. Configuration and rules files come along when needed. The SQL and Databricks connectors run against live data without exports.
A REST API lets teams trigger runs from schedulers or ELT pipelines. And the UI stays for analysts who want to upload something and get feedback right away.
A data quality tool that only works with data in the format you prefer isn’t a data quality tool. It’s a demo.
How we made the AI steps explainable
LLMs without traceability are a black box, and a black box has no place in a data quality system. When you combine deterministic checks with language model interpretation, people reasonably want to know what ran, what the model saw, what it returned, and how much it cost.
We integrated Langfuse for this. It gives full trace visibility into every LLM-driven stage: per-agent spans, token usage, latency. All of it grouped so a single pipeline run reads as one coherent story, not a pile of disconnected API calls.
Useful in production. Just as valuable during development, when a prompt behaves unexpectedly or costs spike and you need to see exactly where and why.
It’s opt-in, and it doesn’t touch the deterministic metric computation at all. That separation matters. Metrics are still calculated the same way no matter what observability tooling you have enabled.
What this actually changes
These features didn’t come from a roadmap. They came from real demand: teams that wanted to run the pipeline daily, clients who needed it integrated into their systems, a real need to explain what the AI was actually doing. Each pressure turned into a feature.
That’s how the tool moved from something you run once to something you rely on continuously. From a one-time assessment to an operational rhythm. And from a proof of concept to the engine behind our Agentic Data Governance Layer. If you want to see what it finds in your own data, the demo runs on your datasets, not ours.