
Your data isn’t as reliable as you think, and it’s likely costing you more than you realize.
Dashboards look correct. Reports are delivered on time. Models keep running. But underneath, data issues quietly distort decisions, leading to missed opportunities, incorrect insights, and expensive mistakes that are hard to trace back to their source.
Traditional data quality and data governance approaches weren’t built for today’s complexity. Manual checks don’t scale, and rules-based systems only catch what you already expect. Governance frameworks often define standards and ownership, but without intelligent, adaptive validation, they struggle to enforce quality in dynamic, fast-moving data environments. The real risk lies in everything you don’t expect: edge cases, inconsistencies, and subtle anomalies that slip through until they become visible at the business level, through broken reports, declining model performance, or loss of trust in data. Meanwhile, maintaining these systems consumes valuable time and slows teams down.
Agentic data quality changes the equation. Instead of relying on static rules, intelligent systems continuously analyze data, adapt to its structure, and surface issues with context. Not just what’s wrong, but why it matters and what to do next. The result is a shift from reactive firefighting to proactive decision support, where data quality becomes a core pillar of modern data governance and a driver of better, faster, and more confident business outcomes.
Architecture: state machine with specialized agents
At its core, this approach is built around a simple idea: instead of forcing teams to define and maintain endless rules, the system builds an understanding of your data automatically and uses that understanding to assess quality.
Rather than processing data in a rigid, step-by-step way, it analyzes multiple aspects of the dataset in parallel, combining them into a unified view. This allows it to scale across large and complex datasets without slowing down or requiring constant manual intervention.
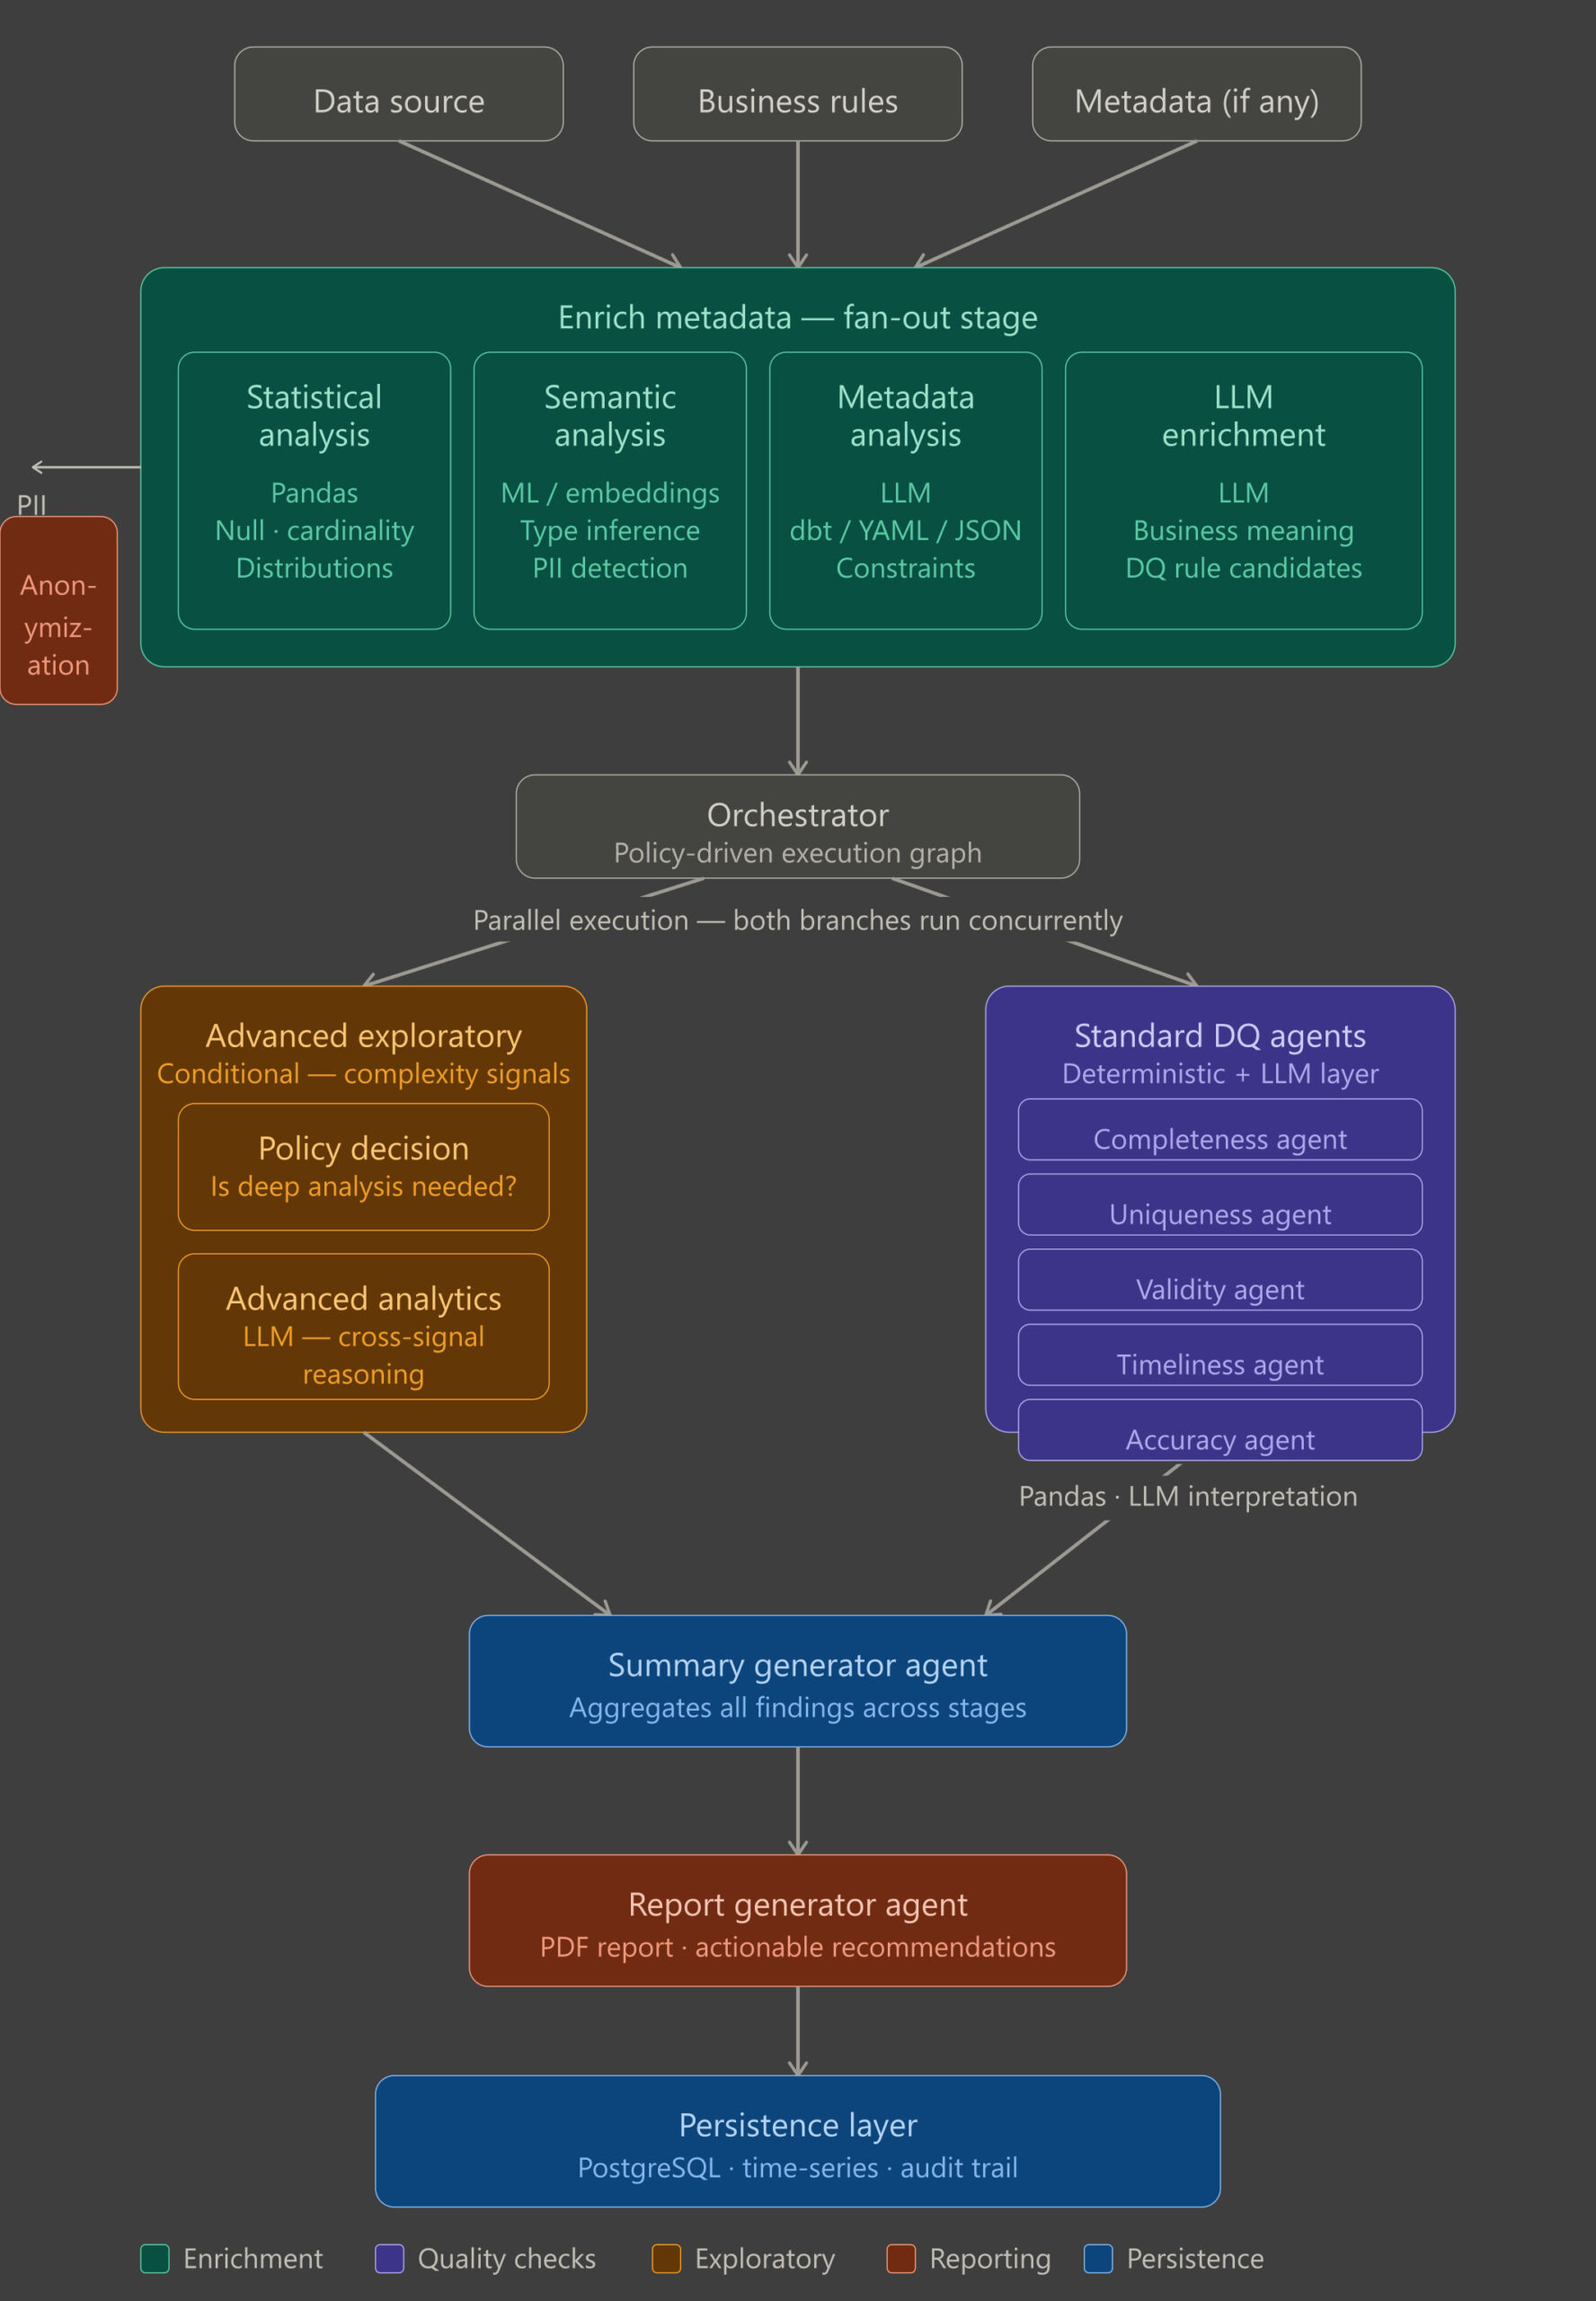
The process is structured into a few key stages:
1 Metadata Enrichment
The first step is to understand the data. Instead of relying on predefined rules, the system automatically enriches each column with both statistical and business context, creating a foundation for all downstream quality checks. This is achieved through a combination of complementary steps.
- Statistical profiling uses statistical methods to capture key characteristics such as completeness, distribution, and uniqueness, providing a reliable baseline for understanding the data.
- Semantic labeling applies machine learning models to interpret what each column represents by analyzing names and values, making the system resilient to inconsistent or unclear schemas.
- Configuration alignment incorporates any existing documentation or predefined constraints, ensuring that business expectations are taken into account.
- Metadata synthesis leverages language models to combine all signals into a unified, structured representation, including inferred relationships, suggested rules, and PII detection to highlight sensitive data and support compliance.
The outcome is a shared, context-rich view of the data that enables more accurate and scalable quality assessment in the steps that follow.
2. Quality assessment
In this stage, the system evaluates data quality across six key dimensions, providing a clear picture of where issues exist and how they impact business decisions. Each check runs independently and in parallel, making the process fast and scalable.
A core principle of the system is the clear separation between automated computation and interpretive analysis. Heavy data quality checks are handled deterministically, ensuring results are reliable, consistent, and reproducible. Meanwhile, contextual reasoning and summarization are applied on top, providing actionable insights without compromising trust in the underlying metrics.
- Completeness: Measures whether the data is actually there and whether it should be. Identifies missing or incomplete data and highlights whether gaps are acceptable or critical, helping teams pinpoint issues in data collection or system design.
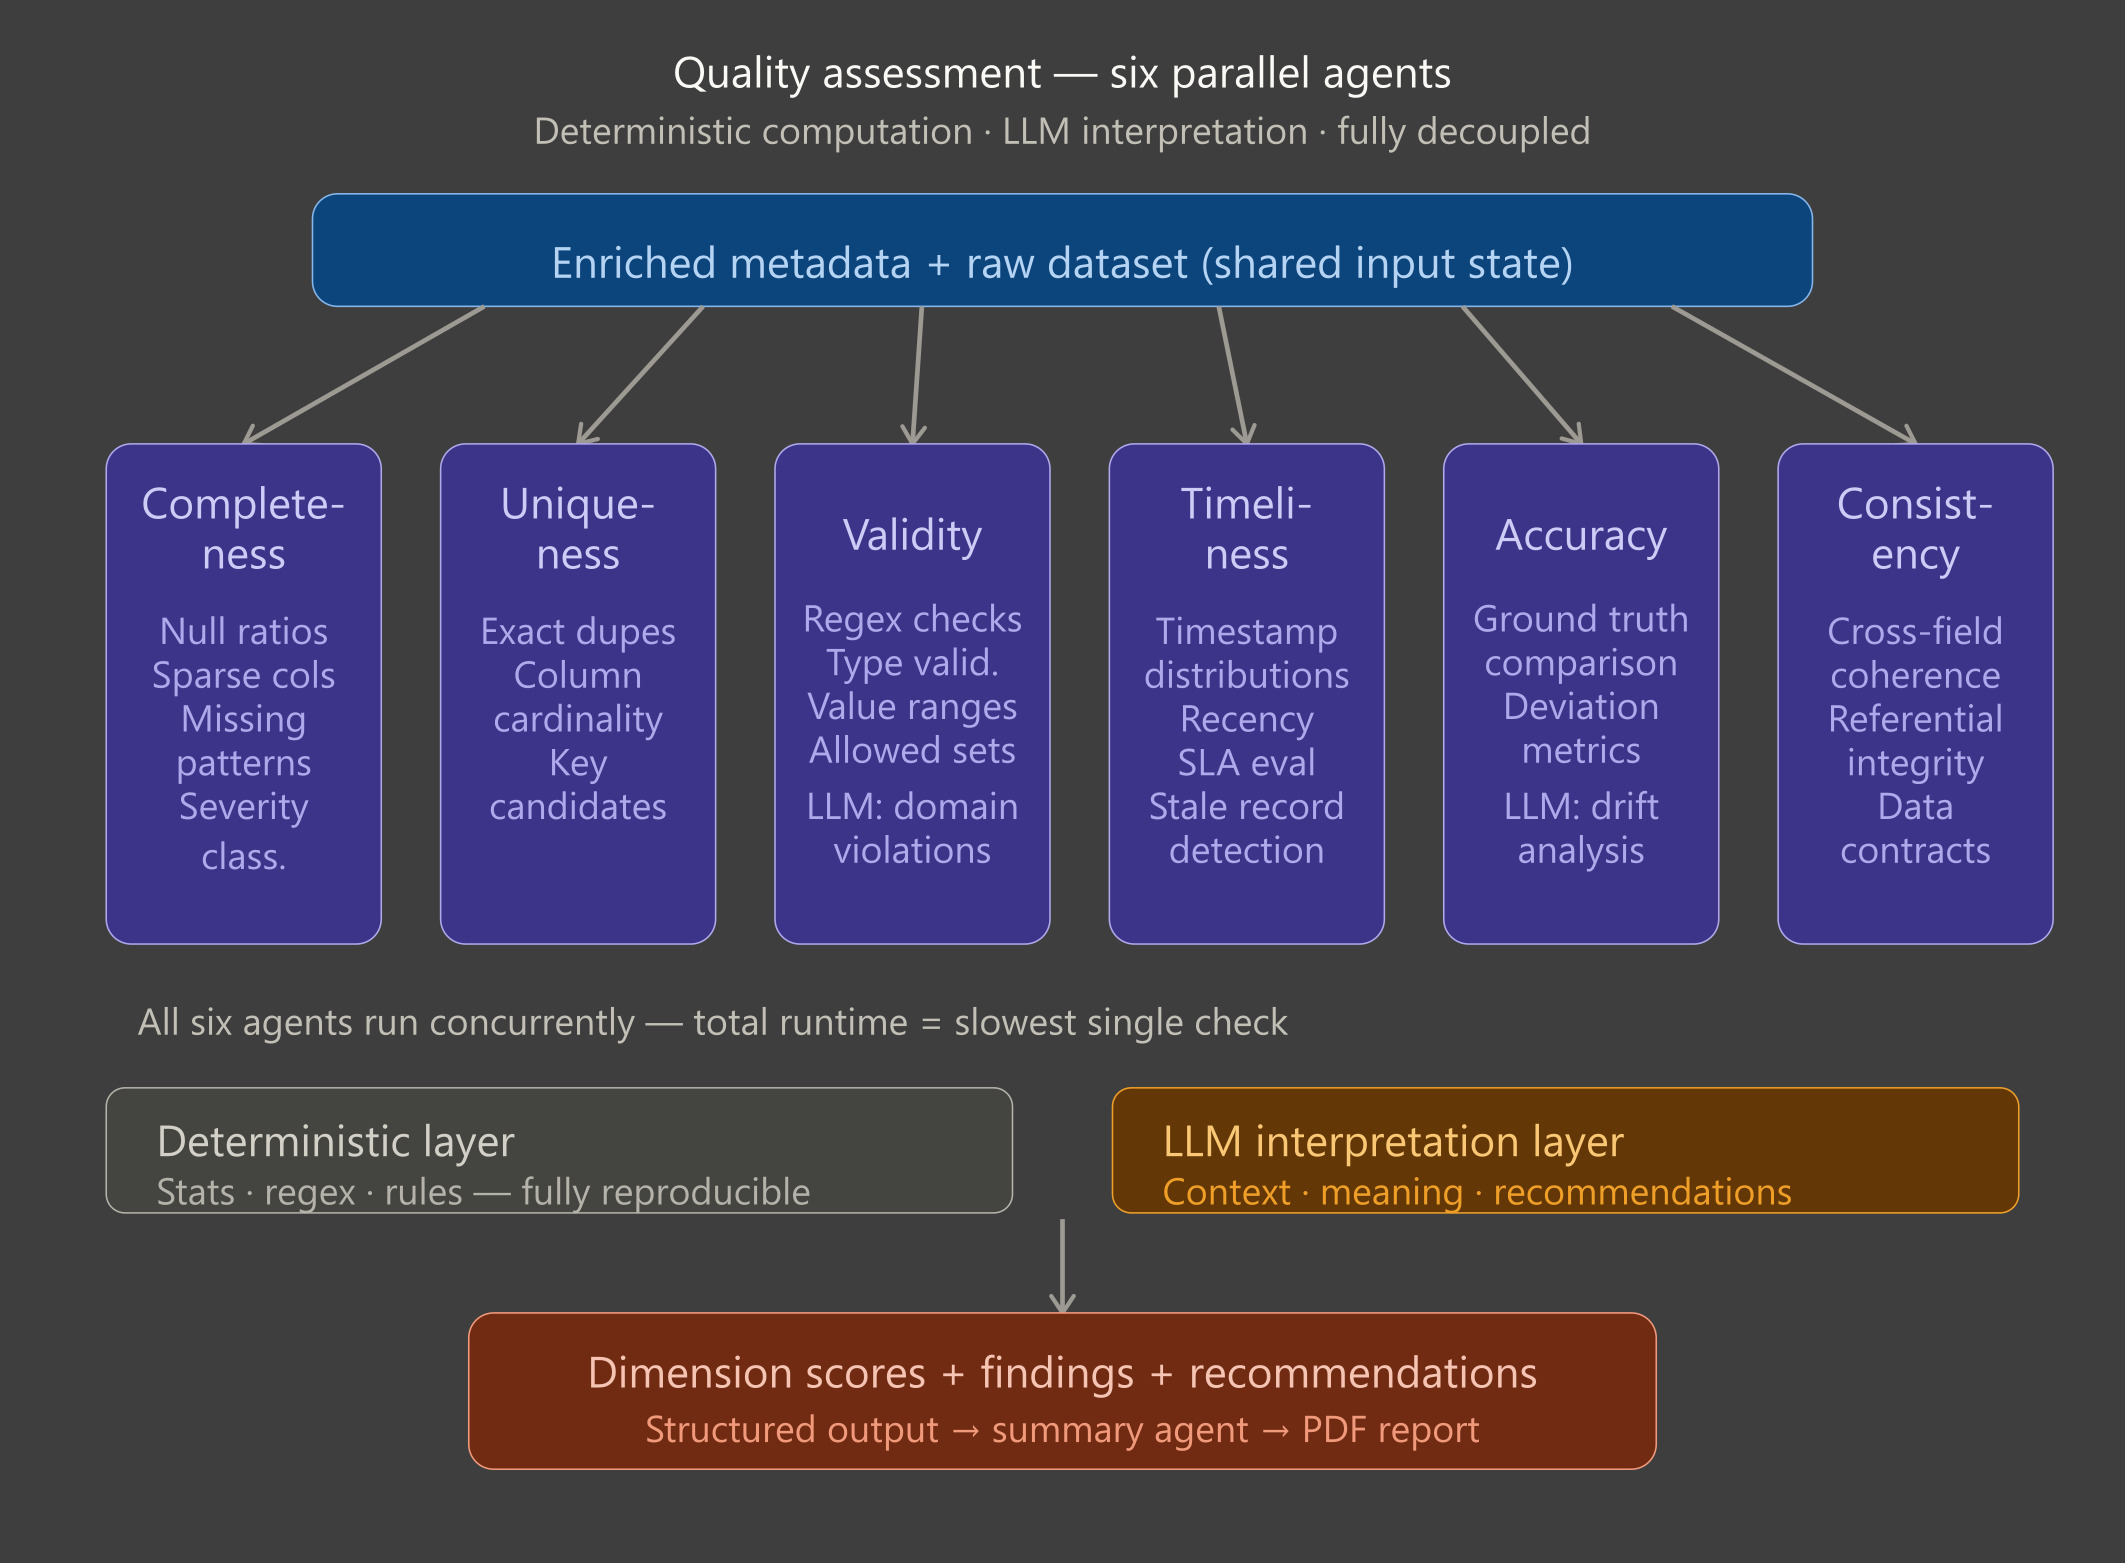
- Uniqueness: Finds duplicates, but more importantly, decides if they matter. Detects duplicates and flags meaningful violations that could affect reporting, analytics, or operational decisions.
- Validity: Checks if values follow the rules, both explicit and implicit. Ensures data follows expected rules and business logic, catching errors that could distort insights or automated workflows.
- Timeliness: Evaluates whether the data is fresh enough to be trusted. Checks whether data is current and up-to-date, helping teams rely on fresh information for real-time decisions.
- Accuracy: Measures how close the data is to a trusted source.
Compares data against previously defined trusted sources to highlight discrepancies, enabling confidence in reporting and downstream processes. These trusted sources must be explicitly established in advance, along with clear definitions of what should be validated against them for the given use case.
- Consistency: Ensures the data makes sense across fields and systems. Verifies alignment across systems, fields, and business rules, ensuring that decisions are based on coherent and trustworthy data.
By separating heavy computation from interpretive analysis, the system delivers reliable, actionable insights quickly. For business teams, this means fewer surprises, faster detection of issues, and a clear understanding of where attention is needed, without waiting for slow, manual audits.
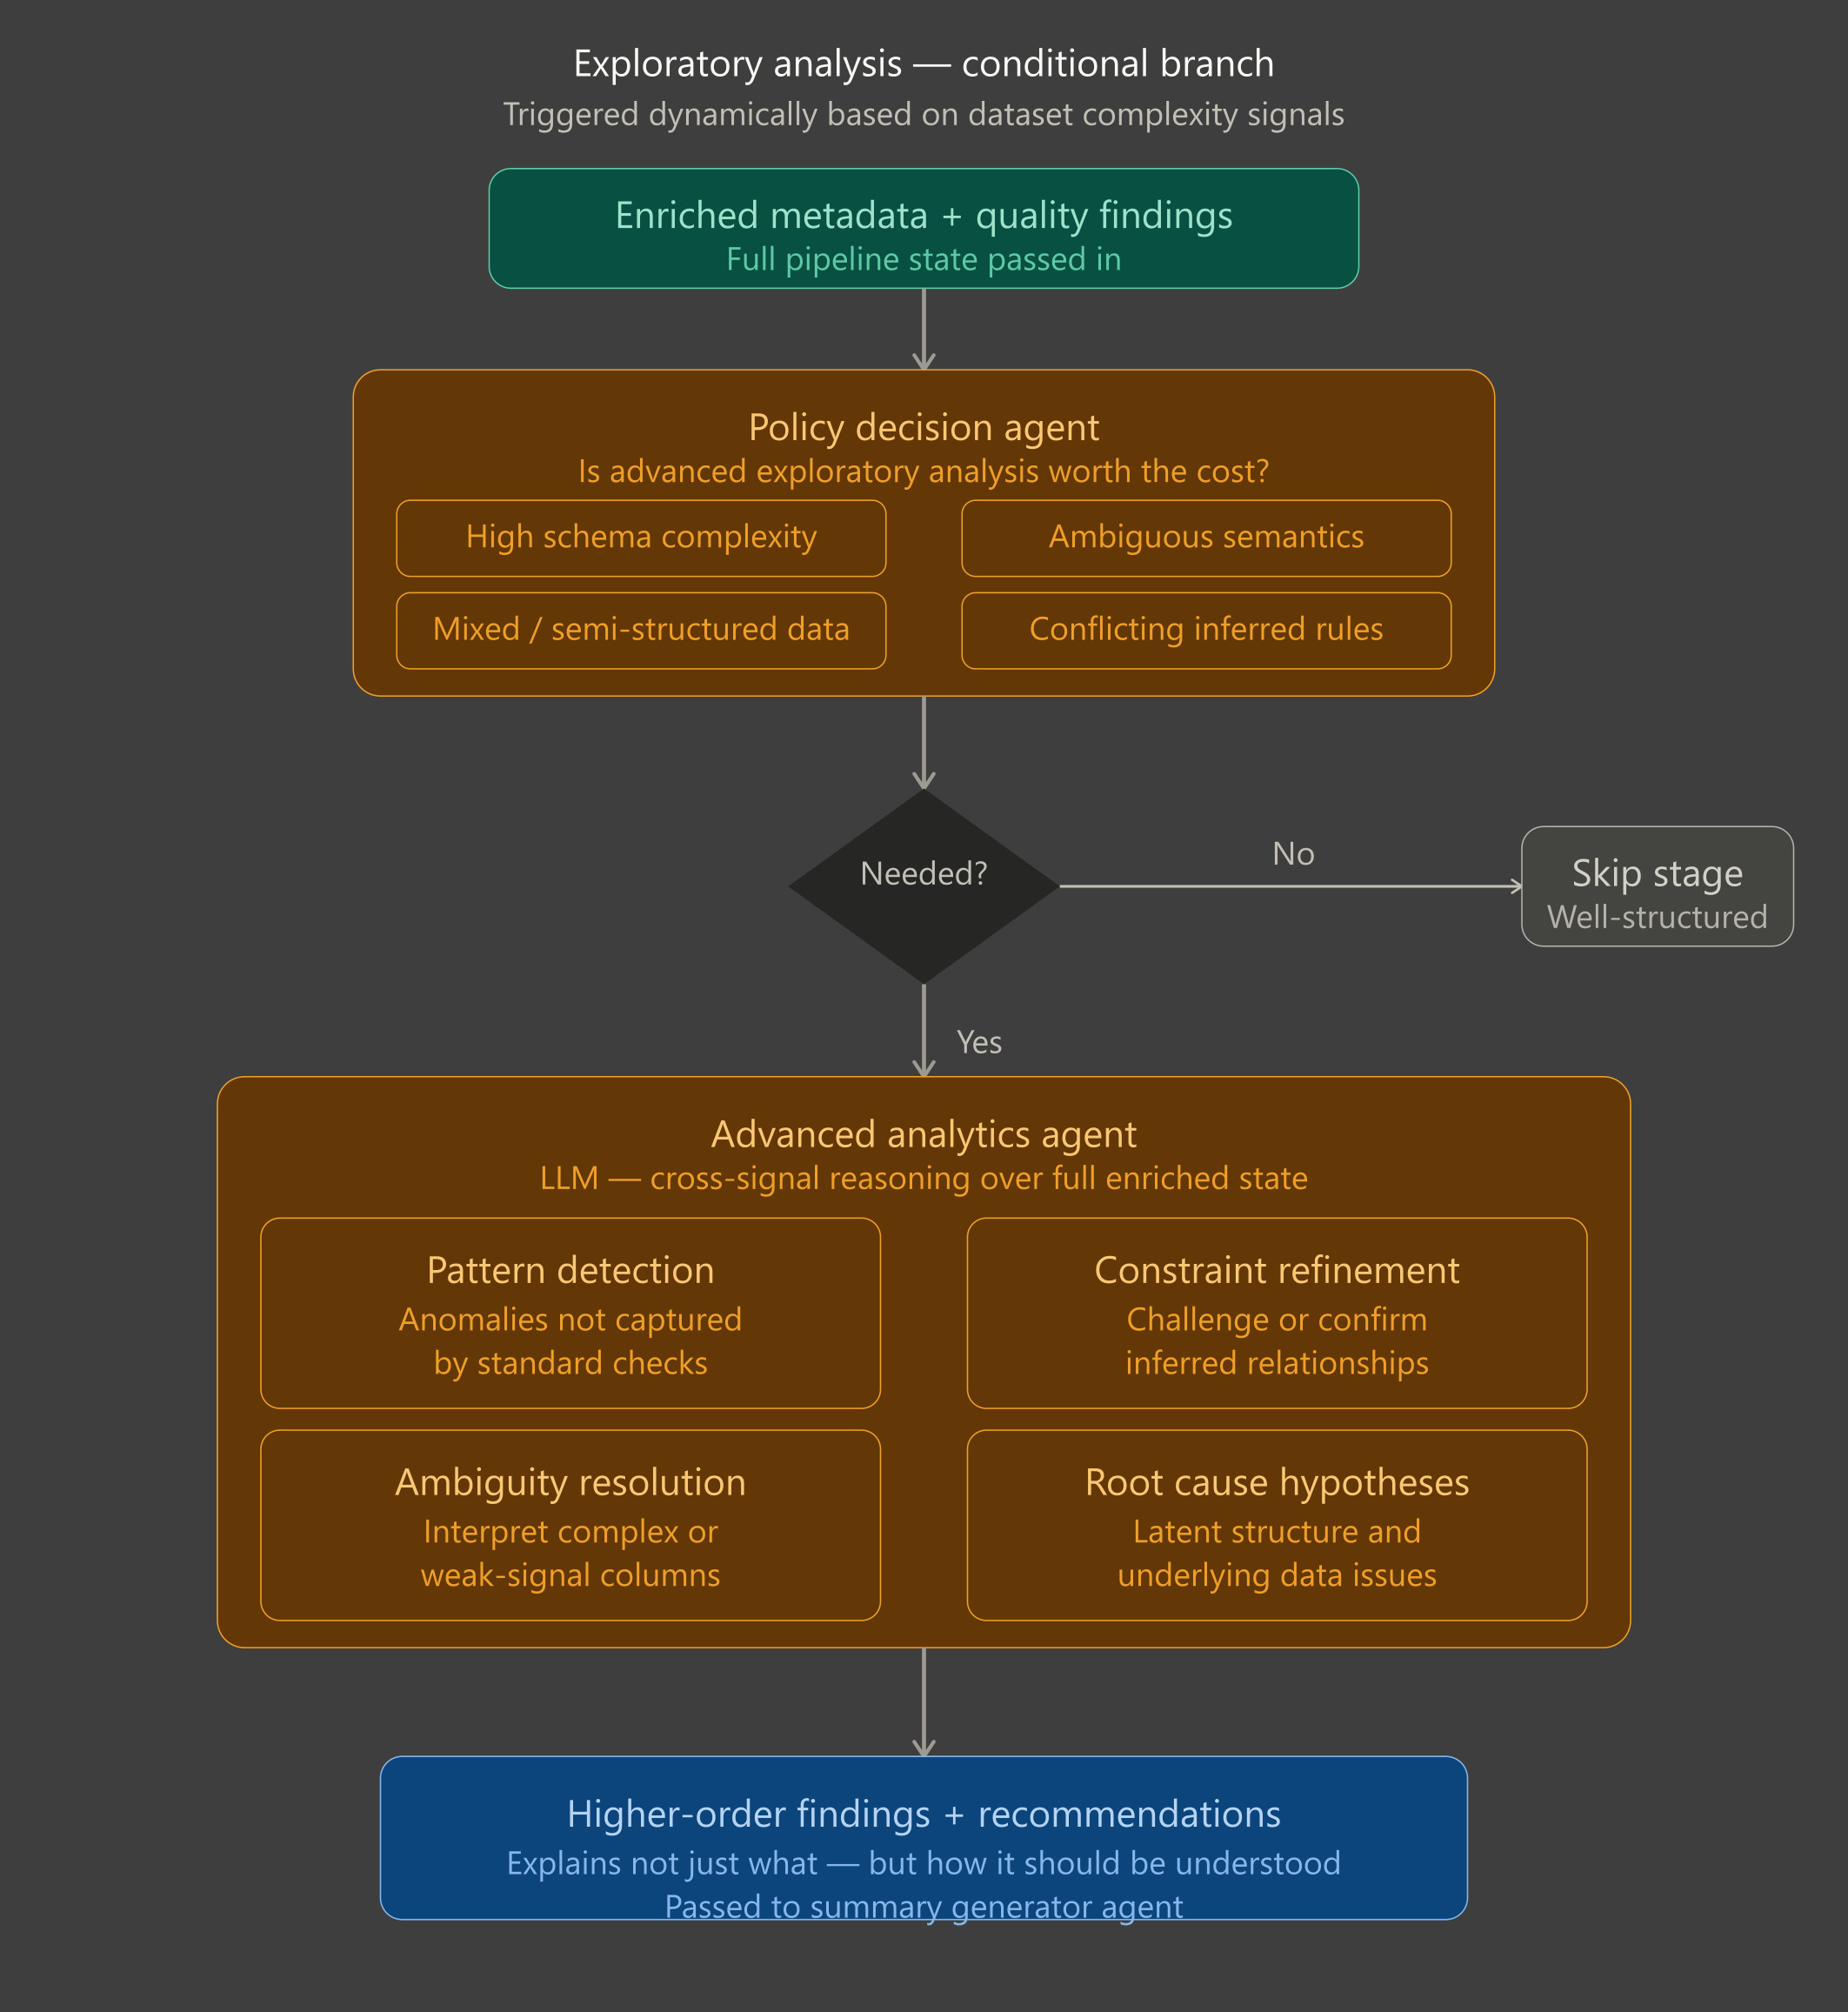
3 Exploratory analysis
Not all datasets are straightforward. Some contain ambiguous fields, mixed data types, or complex patterns that standard checks cannot fully capture. The exploratory stage is designed to handle these cases, activating only when deeper analysis is needed.
When triggered, it examines the enriched dataset to uncover hidden issues, latent structures, and subtle anomalies. This stage goes beyond counting errors, it interprets the data in context, identifies patterns that matter to your business, and highlights potential root causes behind unexpected behaviors.
By running selectively, the system stays efficient, focusing extra effort only on datasets that are complex or poorly understood. The output complements standard quality metrics with actionable insights, helping teams understand not just what is wrong, but why it’s happening and where to take corrective action.
4 Reporting and Continuous Tracking
Reporting: All findings from the quality assessment and exploratory stages are aggregated into clear, structured reports. These summaries provide teams with a snapshot of data health, highlighting issues, patterns, and recommended actions in a format that is easy to digest and share.
Continuous Tracking: Data quality isn’t a one-time check; it’s an ongoing signal. Each pipeline run is captured in full, preserving metrics, metadata, and context. Over time, this builds a historical record that allows organizations to:
- Track improvements or degradations in data quality
- Detect emerging issues before they impact business decisions
- Reconstruct past runs for audit and compliance purposes
- Compare datasets across systems or environments to identify systemic risks
By capturing the full context, not just the results, the system transforms data quality from a static validation task into a measurable, traceable, and continuously improving capability, giving business teams the confidence to act on their data with clarity and precision.
Why this approach works (and what it enables)
At first glance, this might seem like a standard data quality system with added intelligence. The key difference lies in how responsibilities are split to balance reliability and insight. Core metrics such as completeness, uniqueness, and consistency are calculated deterministically, ensuring results are reproducible, accurate, and free from ambiguity. At the same time, the system interprets meaning, infers intent, and flags only deviations that truly matter, providing context for decisions. Each stage operates with clear inputs and outputs, making the process predictable, traceable, and adaptable across different datasets.
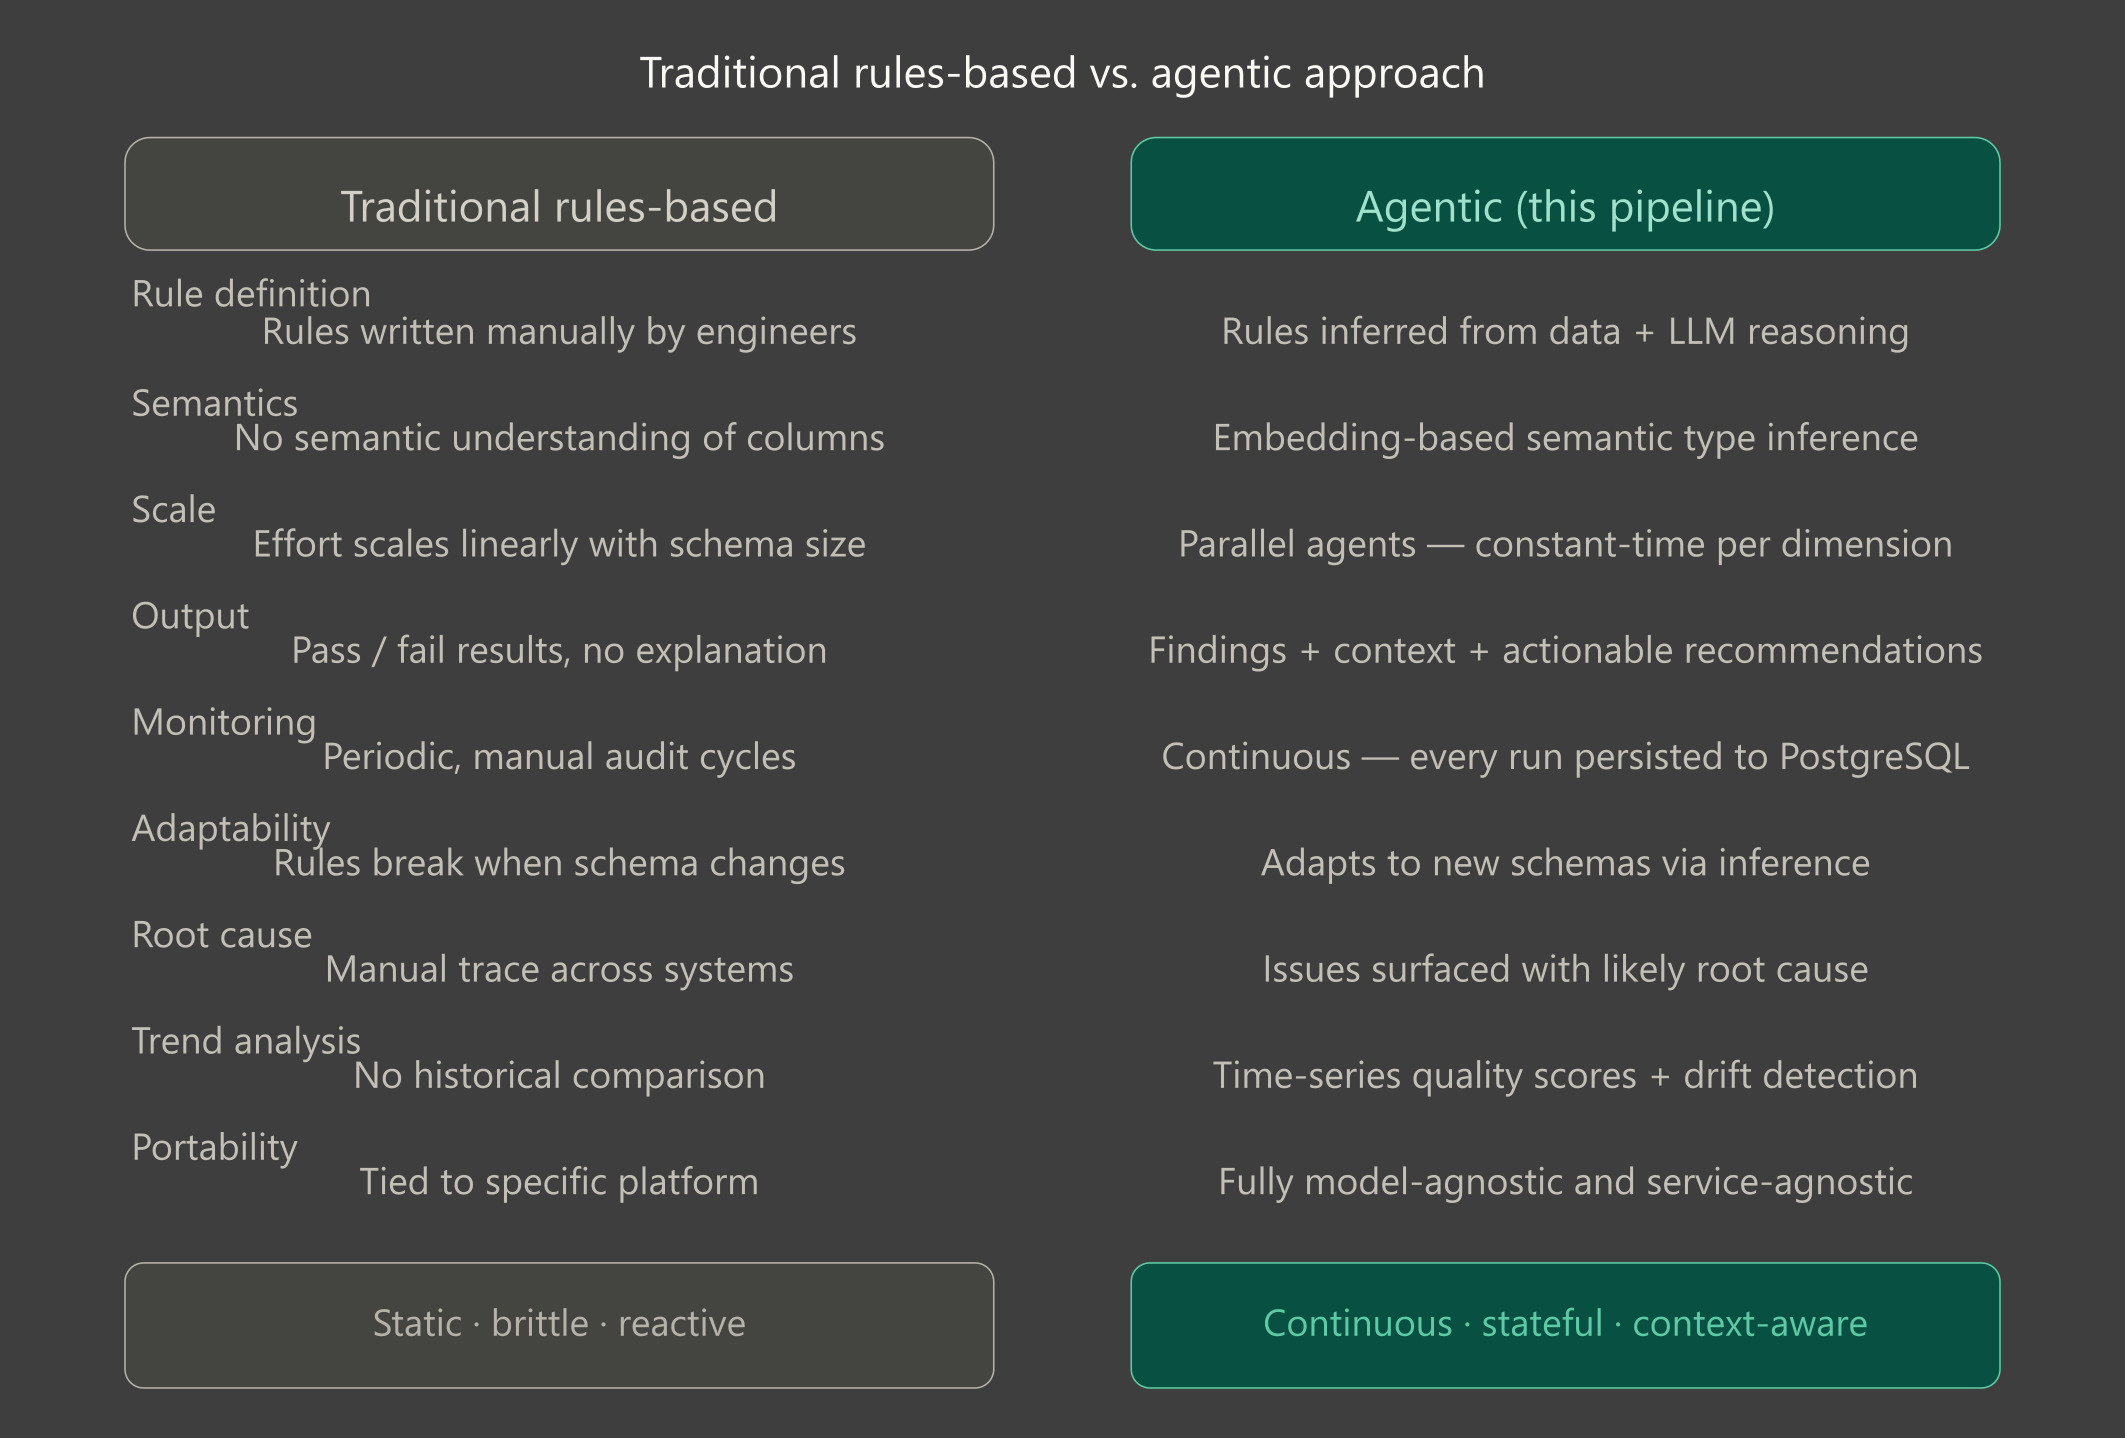
In practice, this design transforms how organizations manage data quality. Issues come with context and likely causes, reducing time spent investigating errors across systems. Teams spend less effort maintaining rigid rule sets, as the system adapts to new datasets using inferred signals, while ensuring consistent quality standards across environments. Continuous monitoring of every run enables trend analysis, regression detection, and SLA tracking, turning data quality from a reactive, one-off task into a continuous, scalable capability. The result is greater confidence in data, smoother operations, and a system where data quality scales with your business instead of becoming a bottleneck.
Conclusion
Data quality is no longer a checkbox, it’s a continuous, strategic capability. By combining reliable validation with context-aware reasoning, organizations can detect issues, understand their impact, and act quickly. At the same time, this shifts data governance from a static set of rules into a living system, one that continuously monitors, enforces, and adapts as data evolves. The result is lower operational risk, faster and more reliable decision-making, and a data foundation that scales with the business. Agentic data quality doesn’t just fix data, it makes it trustworthy by design.