

The following blog post provides comprehensive step-by-step instructions of implementing a custom API usage tracking solution for our deployed MuleSoft applications. It covers the benefits of the solution itself, how to achieve extra value from using the Anypoint REST APIs and its usage. The aim of the blog is to help organizations to automate their API usage monitoring, resulting in faster delivery of metrics and analytics which may be critical for future business decisions.
MuleSoft have an in-house solution for this kind of problems, but it is limited to client applications (contracts), so if we have 1:1 relationship for each client application linked with only one application, the solution by MuleSoft is working exceptionally. The challenge arises when there are multiple distinct consumers from various locations of the same API. The following use case presents an innovative approach to address these challenges by creating an automated solution. This solution enables the generation of analytical reports that separate API usage based on the Applications themselves, without relying on their corresponding Client Applications. Importantly, this approach ensures robust security measures without requiring client enforcement.
Anypoint Platform includes REST APIs that allow programmatic access to a lot of functionalities and resources within the Anypoint platform. These REST APIs allow users to interact with Anypoint Platform programmatically.
Prerequisites
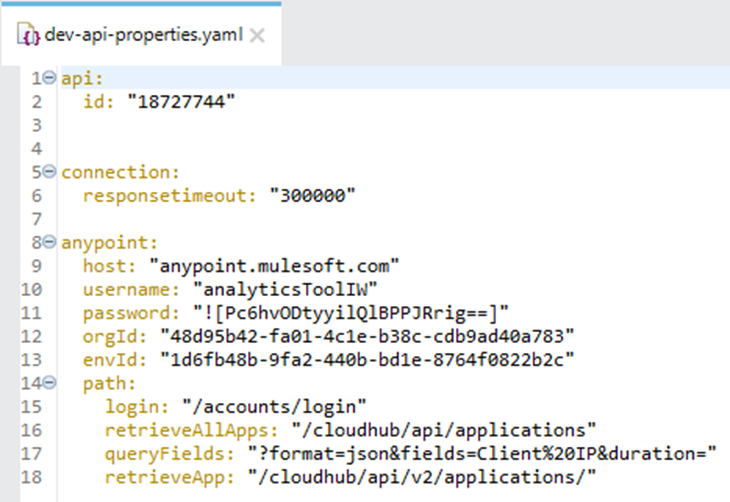
Before we dive into the implementation process, there are a few configurations that need to be set up. Following MuleSoft’s best practices, we store the configuration properties in a separate file. In the example provided below, the only modifications required are to replace the Anypoint username, password, organization ID, and environment ID with your own credentials. It’s important to note that the password value is encrypted using the security properties module to adhere to security standards. While this step is optional, it is strongly recommended to ensure data protection.
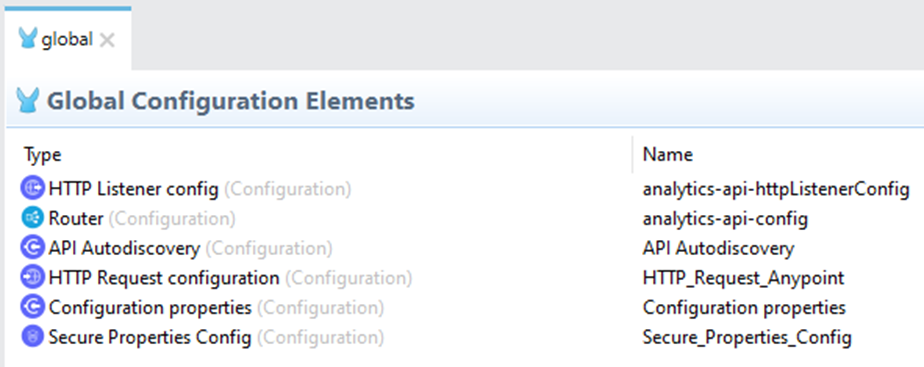
After setting up the properties file, the next step is to create the necessary configurations. This includes configuring the HTTP Listener, Router (if an API specification is available), and API Autodiscovery (if an API instance is created on Anypoint API Manager). The HTTP Request Configuration is used to interact with the Anypoint REST APIs. The Configuration properties link the configurations file to the application itself. Lastly, the secure properties module is utilized for encrypting and decrypting property values, such as the Anypoint password in our case.
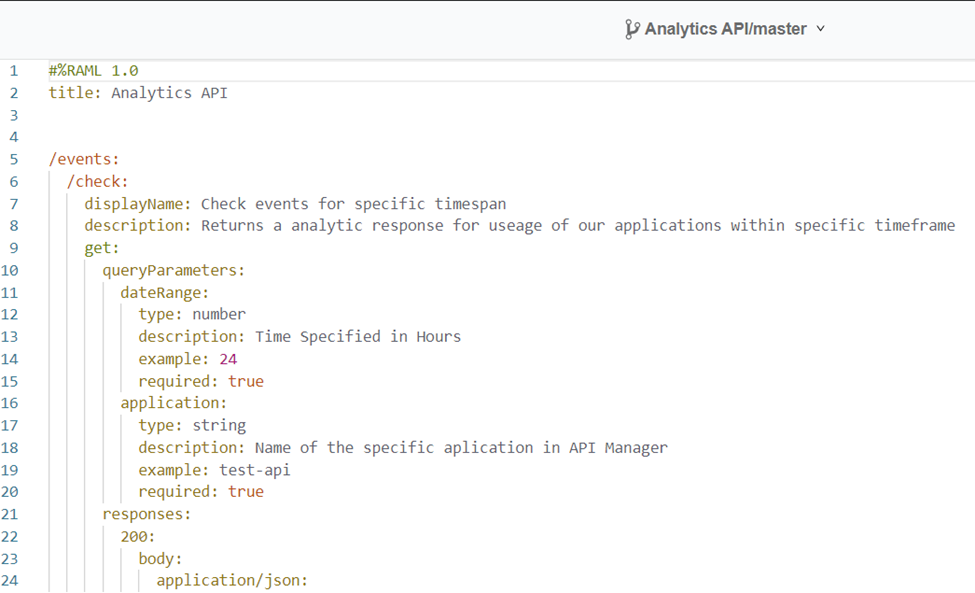
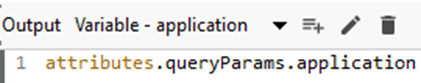
In advance, you can see the API specification created for this Application that is linked to. There are two required query parameters, which are date Range (Time specified in hours) and application (Name of the specific application in API Manager).
Diagram
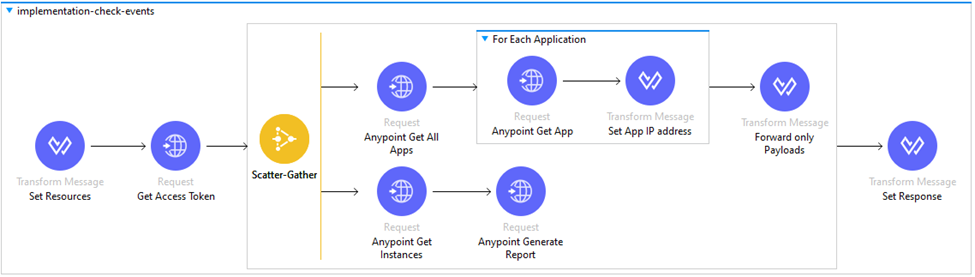
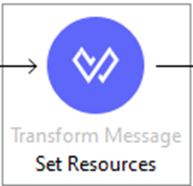
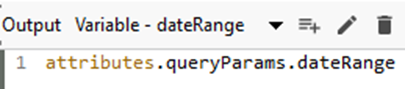
The first connector in our flow is Transform Message which is used to Store the incoming parameters in variables named date Range and application.
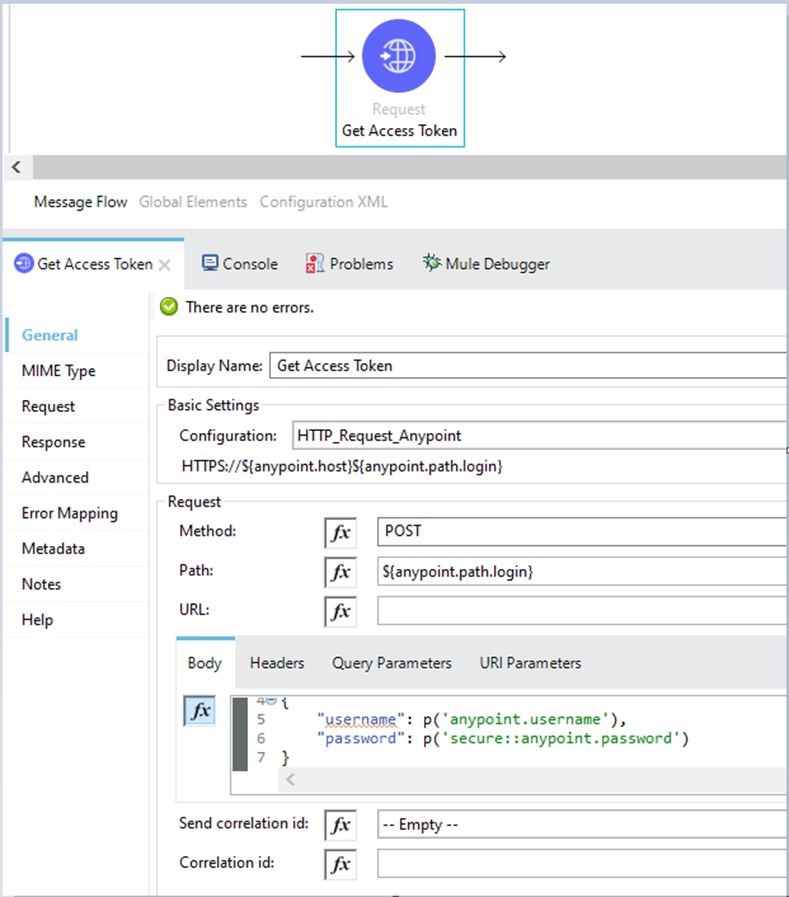
The second connector is HTTP Request, and, in this scenario, interaction is made with Anypoint to retrieve a token which will be used in the further connectors as a way of authentication. You need to pass the Anypoint username and password and the login path from the configurations file.
The next connector is Scatter-Gather which is a routing event processor that processes a Mule event through two different parallel processing routes labeled as Route 1 and Route 2.
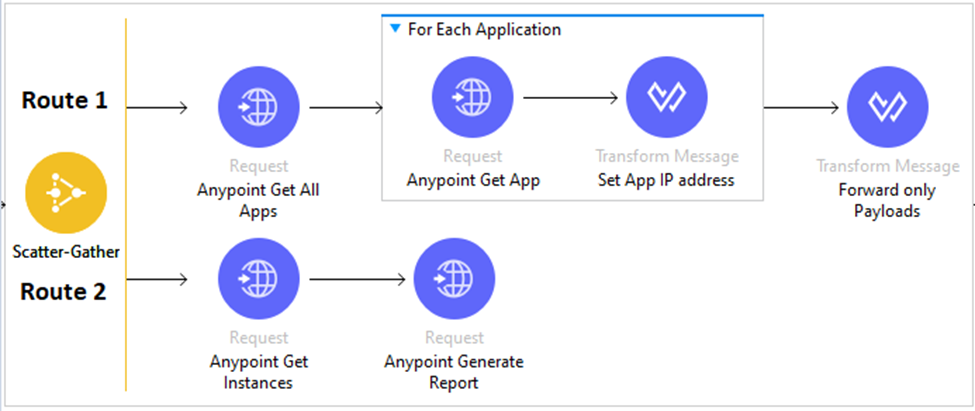
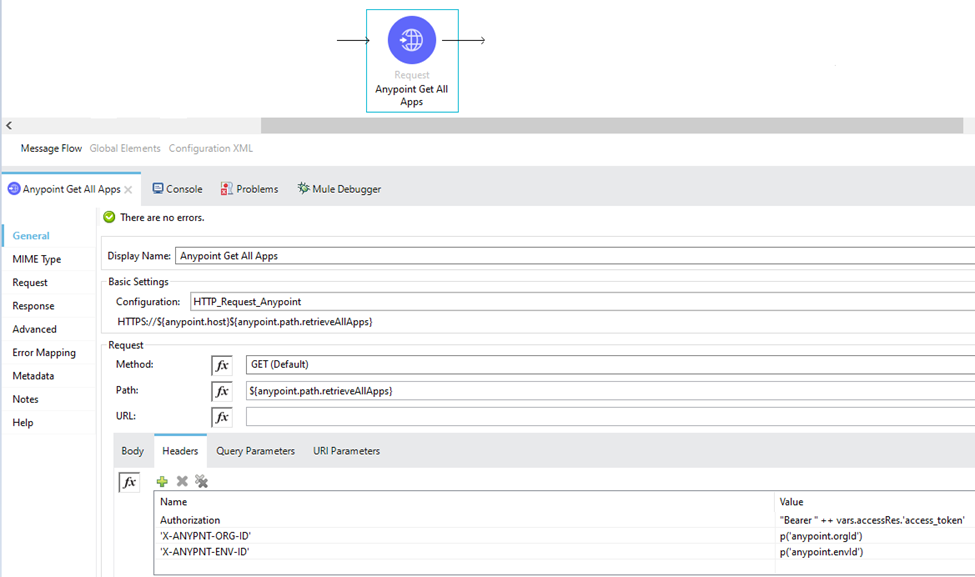
Route 1: The first connector of route 1 is Request which is used to connect with Anypoint and receive information about our deployed Application on Cloudhub under our Runtime Manager. We need to pass the token and both organization and environment id.
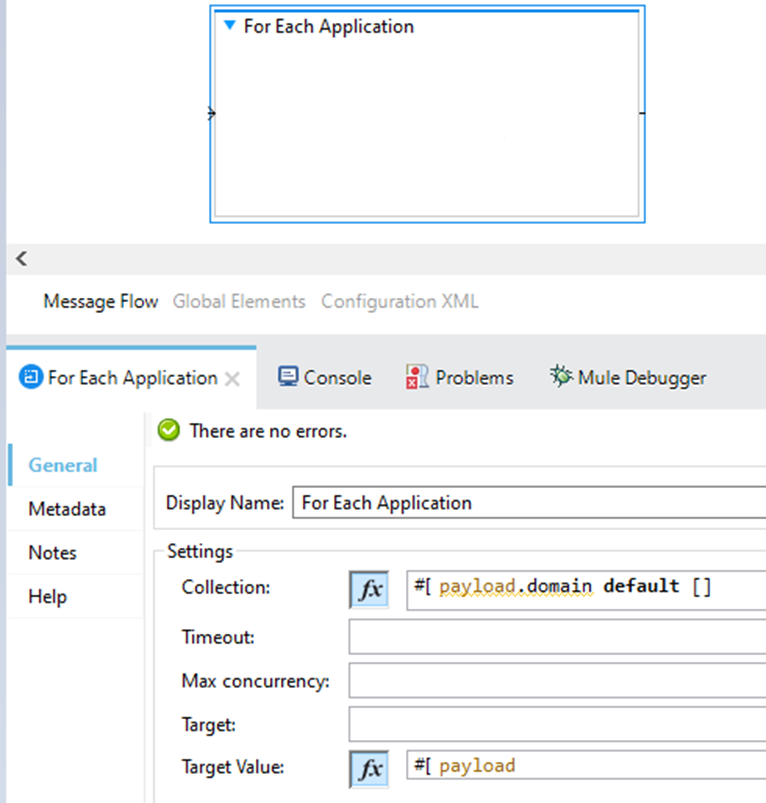
The next component in route 1 is parallel for each so we can have the updated payload in the output of the component itself. As an input collection we are setting the list of our domains (applications).
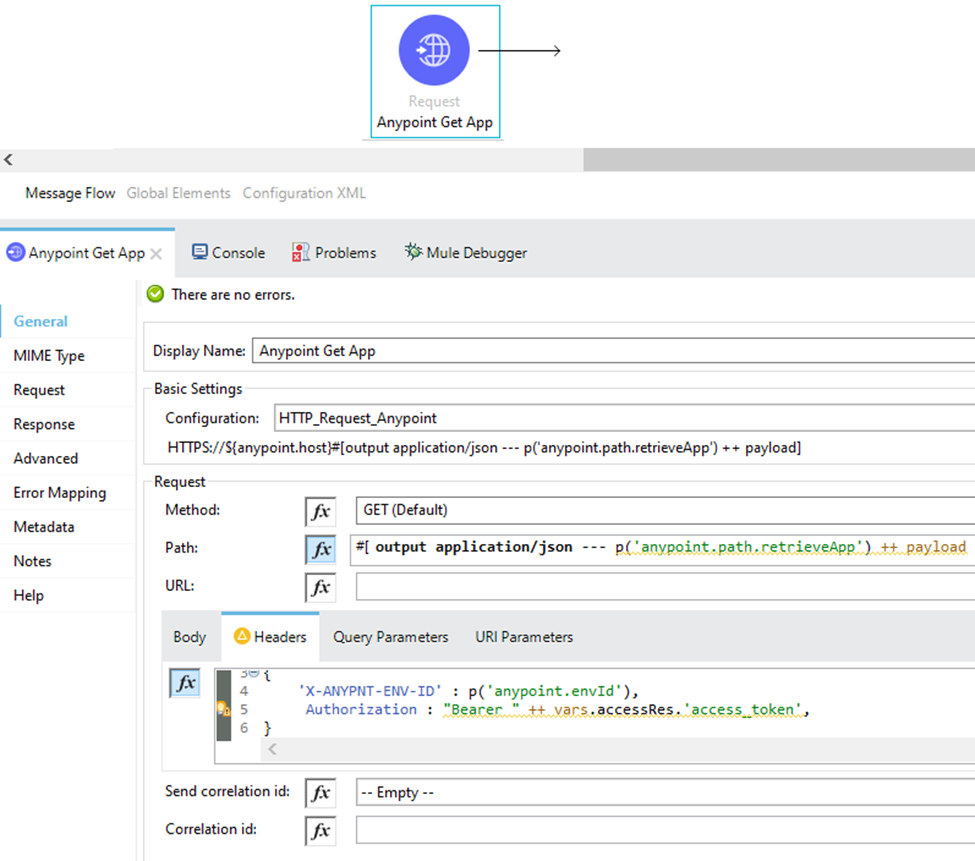
The next component in route 1 and the first component of the For Each is Request which is used to interact with Anypoint to get additional information for each one of our domains (applications). The most specific information that we need from the response will be the IP address or addresses (if they are deployed on multiple Cloudhub workers) of the deployed applications. We are passing the payload which is the current domain application, environment ID and the token for Authorization.
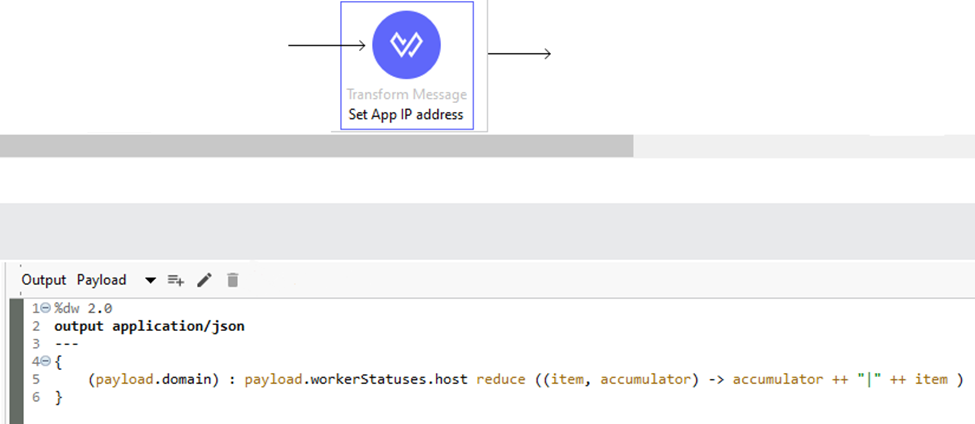
The next component in route 1 and the second component of the For Each is Transform Message which is used to set the current Application with their corresponding IP address/addresses. The Application name is set as a key and for value we are setting the hosts (IP address), in case if many we are concatenating them with pipe (|) in between.
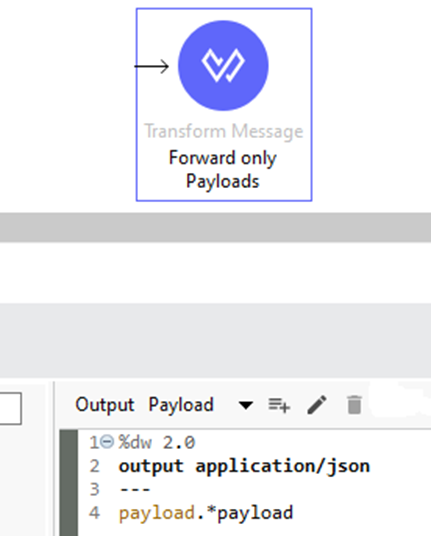
The final component of Router 1 is the Transform Message, which serves the purpose of eliminating any unnecessary data obtained from the output of the parallel forEach, such as attributes and headers.
Route 2:
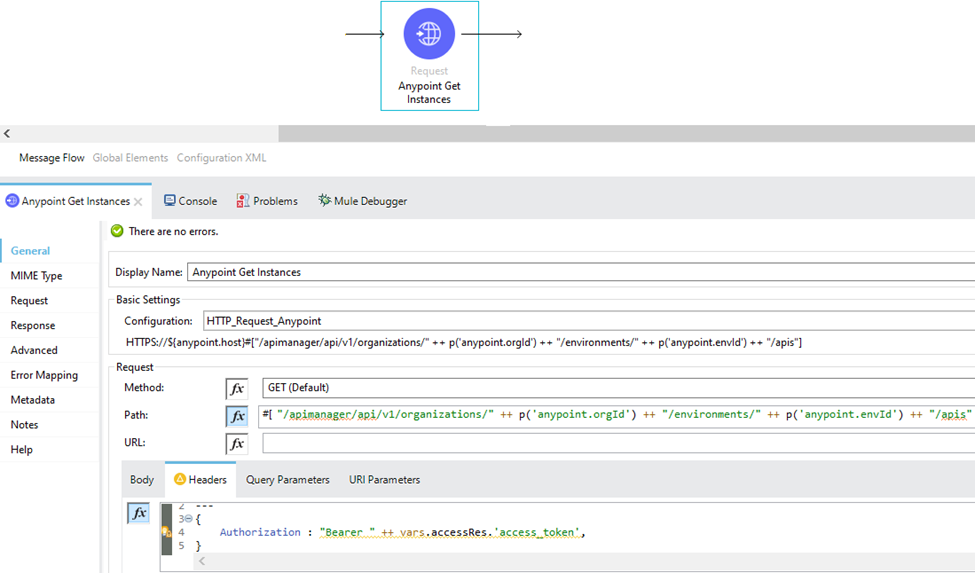
The first connector of route 2 is request which is used to retrieve all our API instances from the API Manager by specifying the environment and organization id in the URL path itself and providing the token for the authorization part in the headers.
The second and last connector of route 2 is a request which is used to generate the report for the specific API. The report contains each request that was made to the API for a specific time span.
The URL section will be discussed in detail later. In addition to that, we include an authorization token in the headers. The response will include an array that captures each request made to the API for which the report is being generated, within the specified time frame.
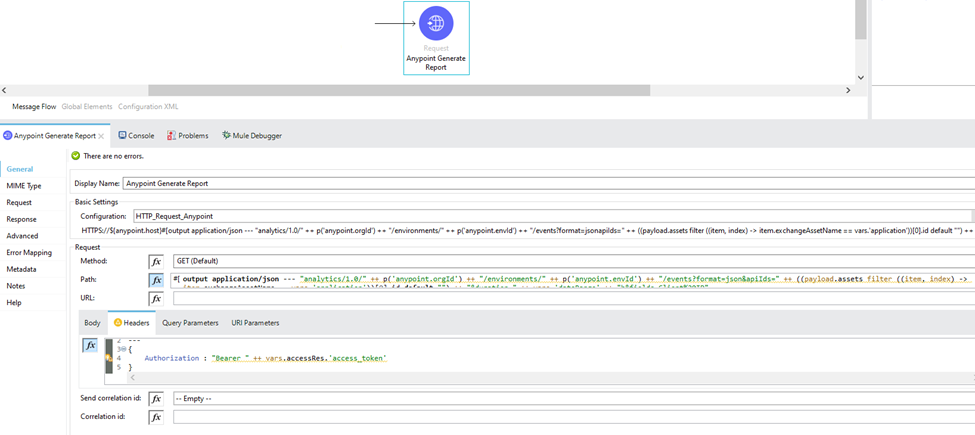
In the URL section, as shown below, we specify the environment and set the response format for the report as JSON. We filter the API assets retrieved in the previous step by the application name provided in the initial request parameter to specify the API ID. Additionally, we set the duration for the report in hours, which was also provided in the initial request parameter. From the optional fields in the response, we extract the client IP address that interacted with our API.

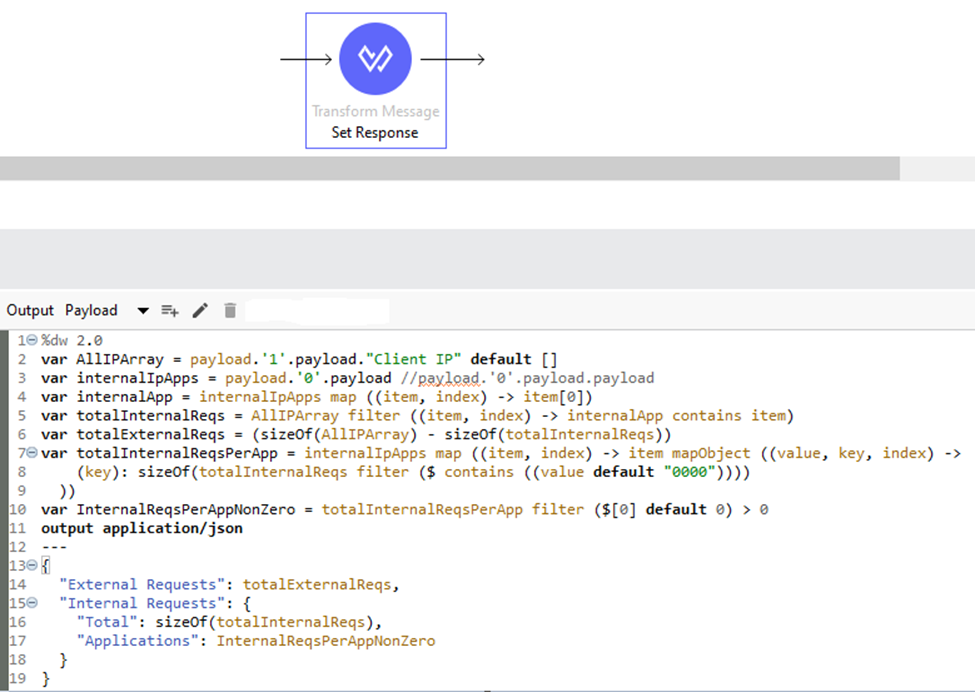
The final component of the flow is the Transform Message, where extensive calculations and processing take place to generate analytical results in the response. The DataWeave expression handles each request from the generated report, whether it originates from an external API or an internal API. In the case of internal APIs, it checks which specific internal API it belongs to and aggregates the total number for that particular internal API.
Calling the Analytic Implementation
You need to provide an API name to the request so check the API Instance name. Proceed to API Manager on The Anypoint Platform and Copy the name of the API Instance that we want to check API usage for that API.
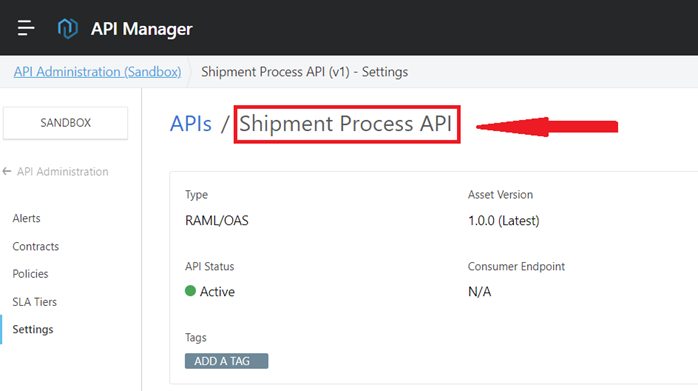
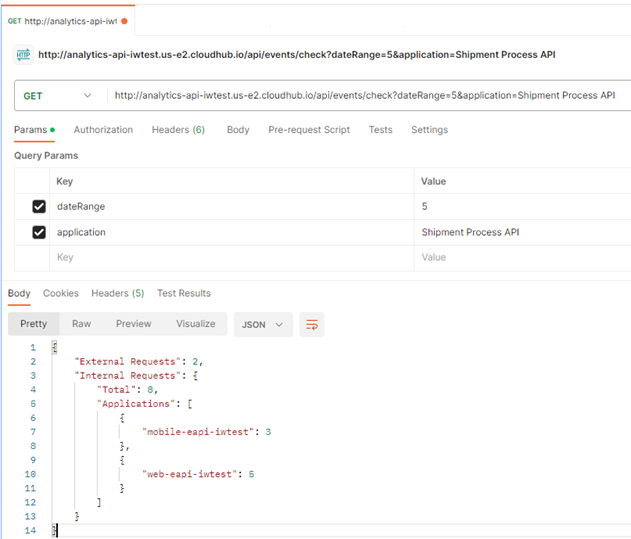
Shown below is an image depicting an example request and response for the implementation outlined in this blog post. In this particular scenario, we are generating a report for the Shipment Process API that was selected in the previous step. The dateRange value is set to five, indicating that the report will include requests made to the Shipment Process API within the last five hours.
Upon examining the response, we observe that the Shipment Process API received a total of two external requests and eight internal requests. Among the internal requests, three originated from the Mobile Experience API, while the remaining five originated from the Web Experience API.
Conclusion
In this blog post, we have presented a comprehensive solution for effectively tracking and monitoring API usage in your deployed applications. By leveraging the capabilities of Anypoint REST APIs, you can generate detailed analytical reports that empower businesses to make informed decisions and maximize the utilization of their APIs.
In today’s rapidly evolving software development landscape, it is crucial to have robust monitoring and tracing mechanisms in place to ensure optimal performance, identify potential issues, and optimize system resources. By implementing the solution outlined in this blog, you can effectively address these challenges and gain valuable insights into your API usage.
You can read the case study for the case above on the following link:
Enhancing API Tracking and Reporting for High-Reliability Medical Supplies Operations