
In the dynamic landscape of cloud computing, organizations often leverage multiple Azure services to power their applications and workflows. With Azure Log Analytics, you can centralize and analyze logs from diverse sources like Azure Functions, RPA, Azure SQL, and Logic Apps. In this blog post, we’ll explore how you can seamlessly combine logs from different sources and create dedicated workbooks for comprehensive visualization.
Here is a high-level diagram of how this monitoring solution is intended to look like:
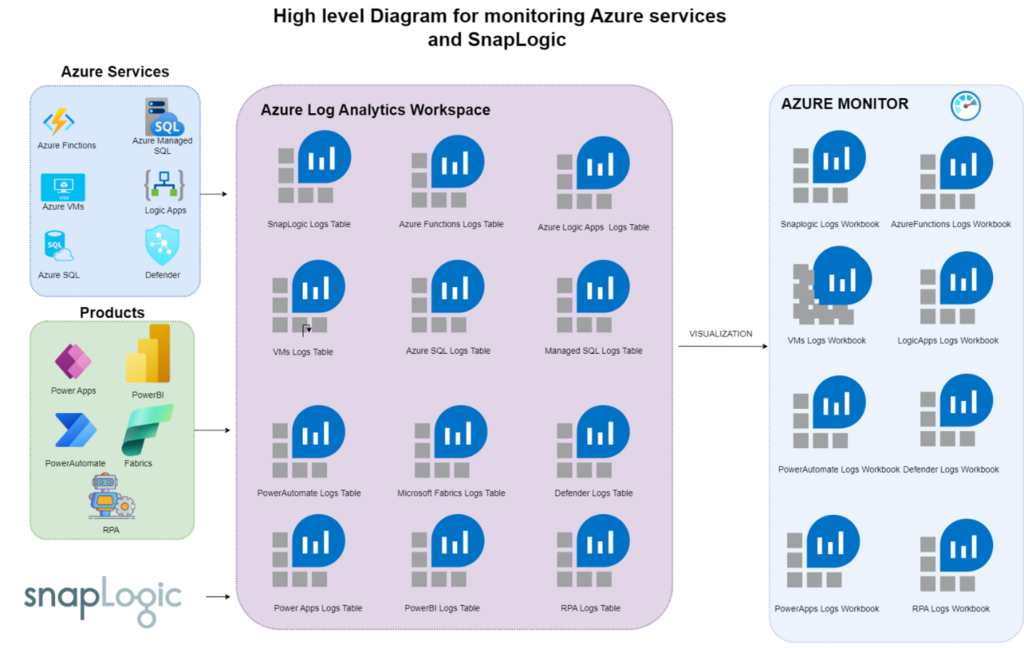
With this approach, we can have multiple sources of logs from various Azure services or products. The logs will be captured and kept in a separate Log Analytics table per source that is not Azure native, for example, SnapLogic. The Azure Native Services or Products can be connected with a Log Analytics workspace on creation. If we didn’t use that option, we can always do that post-creation and send those logs.
From here, we can visualize them using the Azure Workbooks, where we can easily pull the logs from the tables.
The advantage of using workbooks is that we can combine the data in one workbook from multiple tables, and for example, we can have a good glance at the overall health of all services that are streaming logs.
Here are a few steps that need to be taken to fulfill all of the above:
Step 1: Establishing the Foundation
Create a Log Analytics Workspace:
We are starting by creating a Log Analytics Workspace in the Azure portal. This workspace will be the centralized hub for collecting logs from various Azure services.
Step 2: Ingesting Data into Log Analytics
Configure Data Sources:
Connect your data sources to the Log Analytics Workspace, including Azure Functions, RPA, Azure SQL, and Logic Apps. This involves configuring the necessary settings to ensure that logs from each source are directed to the central workspace.
Step 3: Unifying Logs with KQL Queries
Write KQL Queries:
Utilize the power of Kusto Query Language (KQL) to combine logs from different sources into cohesive datasets.
Step 4: Crafting Insightful Workbooks in Monitor
Navigate to Workbooks:
Within your Azure Monitor tab or Log Analytics Workspace, access the “Workbooks” section. Workbooks are customizable containers for visualizing data.
Create a Workbook:
Initiate the creation of a new workbook. You can start from scratch or leverage a template based on your visualization requirements.
Add Visualizations:
Embed the KQL queries into the workbook to retrieve and display data. Employ various visualizations such as tables, charts, and graphs to represent the data effectively.
Group and Filter:
Organize the visualizations by grouping and filtering the data based on the “SourceType” field. This ensures each source has a dedicated section or tab within the workbook.
Step 5: Saving and Sharing Insights
Save the Workbook:
Once we’ve crafted a compelling workbook, we can save it with a meaningful name for easy reference.
Share the Workbook:
Facilitate collaboration by sharing the workbook with relevant stakeholders. Grant appropriate permissions to ensure users can view and interact with the visualizations.
Step 6: Optional – Scheduling Queries
Schedule Queries:
We can schedule the KQL queries for real-time insights at specific intervals. This keeps the data in the workbook up-to-date, reflecting the latest logs from our Azure services.
In conclusion, Azure Log Analytics empowers organizations to aggregate logs from diverse sources and derive actionable insights seamlessly. By combining the flexibility of KQL queries and the visualization capabilities of workbooks, teams can gain a holistic view of their Azure environment. Whether it’s Azure Functions, RPA, Azure SQL, or Logic Apps, the process outlined in this blog post ensures that every source contributes to a comprehensive and insightful narrative in your Azure Log Analytics workspace.