


Apache Spark
⋮IWConnect Data Management Practice works with a wide range of technologies for processing and analyzing big data. One of them is Apache Spark.
Apache Spark is a powerful computing framework for big data processing, with built-in modules for data streaming, SQL, machine learning and graph processing. As a unified analytics engine, for which we can write application in Scala, Java, Python, R and/or SQL, Spark uses in-memory processing which makes the processing speed very high. It also makes possible to combine and use many libraries for processing and analyzing data.
PySpark
Python is a general-purpose, high-level programming language. It is portable and can be used on different operating systems (Windows, Solaris, Linux…) and provides a wide range of libraries. It is often used for machine learning and real-time streaming analytics.
PySpark is Python API for Spark that lets us combine the simplicity of Python and the power of Apache Spark in order to tame Big Data.
Jupyter notebook
For creating this project, we decided to use the Jupyter Notebook. In this case, “notebook” or “notebook documents” denote documents that contain both code and rich text elements, such as figures, links, equations… Because of the mix of code and text elements, these documents are the ideal place to bring together an analysis description, and its results, as well as, they can be executed to perform the data analysis in real time.
Air pollution project
Everyone is familiar with the application ‘Moj Vozduh’ – it measures the air pollution in every town in our country. Let us say that you want to monitor the air pollution monthly. You want to see the average, the minimum and the maximum amount of PM 10 particles in the period of one month. This can be used for further analysis – maybe you want to design a chart of average amount of PM 10 particles in a period of one year or something similar.
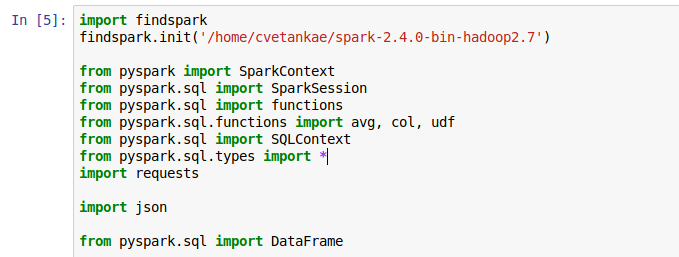
Before we start coding, we need to import the required libraries. For this project we need the following libraries:
Then we need to initialize Spark Session. SparkSession is the entry point to Spark. It is one of the very first objects that needs to be created while developing a Spark application. Once created, SparkSession allows creating a DataFrame (based on an RDD or a Scala Seq), creating a Dataset, accessing the Spark SQL services, executing a SQL query, loading a table and the last but not least accessing DataFrameReader interface to load a dataset in the format of your choice.
Then, we need to initialize the Spark Context. Spark context sets up internal services and establishes a connection to a Spark execution environment.
The third step is the request to the web API that returns the data. Now, to make HTTP requests in Python, we can use several HTTP libraries like:
- httplib
- urllib
- requests


We will be using requests library in this project and in this example, a GET request. The URL for a GET request generally carries some parameters with it. For requests library, parameters can be defined as a dictionary. These parameters are parsed down and added to the base URL or the API – endpoint. All form data is encoded into the URL, appended to the action URL in a form of an array of query string parameters:
To create parallelized collections, we call the parallelize method from Spark Context and it returns RDD. Resilient Distributed Datasets (RDD) is a fundamental data structure of Spark. It is an immutable distributed collection of objects. Each dataset in RDD is divided into logical partitions, which may be computed on different nodes of the cluster.
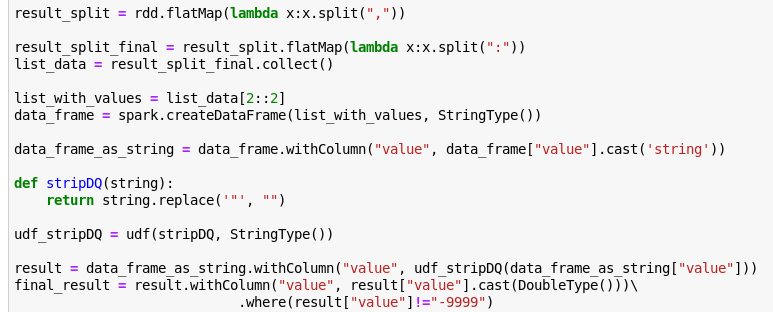
The next steps are for formatting and converting the returned result in the appropriate type. First we need to parse the whole string and then, we can get only the needed data – in this project we are interested in PM 10 particles and we get only these values. Finally, we convert the result in decimal and remove invalid values.
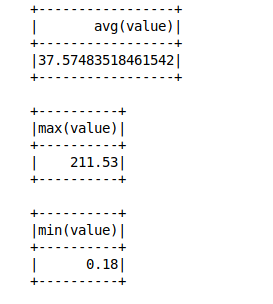
Finally, we can perform some operations on the data. In this example we can see the average, the minimum and the maximum value of PM 10 particles in Bitola in the period of 01.03.2019 and 31.03.2019.
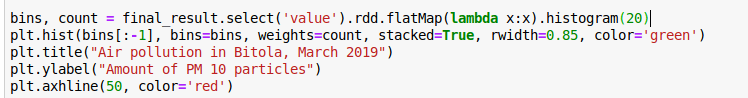
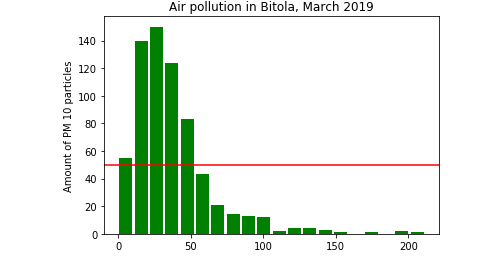
Next, we will visualize the data returned in a histogram, showing all the results measured in Bitola in March 2019. Here is how we can achieve that.
The red line on the chart indicates the maximum allowed amount of PM 10 particles. In the picture we can see that the amount of PM 10 particles at the beginning of March exceeds the maximum.
Conclusion
Pyspark is a great framework to use because of its dynamics and has many advantages. It enables performing scalable analysis, building machine learning pipelines, optimized fault-tolerance mechanisms and it uses DAG (Directed Acyclic Graph) execution engine which facilitates in-memory computation and acyclic data flow resulting in high speed.