
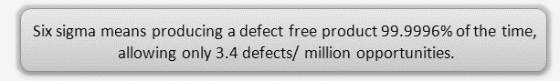
The Six Sigma concept has come to reality to satisfy two basic concepts that drive the companies today: customers’ needs and profitability growth.
Bill Smith, who is an engineer that worked for Motorola, is the person standing behind Six Sigma. Nowadays, Six Sigma is widely used by large companies such as Toshiba, Vodafone, Intel, Honeywell, Samsung Group, and Chevron for quality management and improvement.
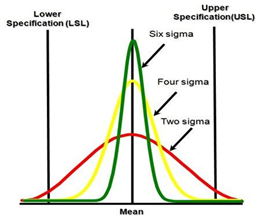
The symbol for Six Sigma is the symbol “σ” in the Greek alphabet which stands for standard deviation from the “mean”. Six Sigma represents six standard deviations from the mean. Standard deviation is used to measure variance, which is an important tool for measuring non-conformity when considering the quality of the output. This means that determining the mean value of the process and eliminating defects with the Six Standard Mean Deviation and the nearest specification limit will eliminate any defects or errors.
The role of top management is inevitably important. They should understand the concept of Six Sigma and commit themselves to its implementation.
Six Sigma implementation
Before starting with the implementation of Six Sigma, its vision should be set up. The first level is Champions which represents the senior manager who champions the project, ensures that it is properly resourced, and uses authority to overcome organizational barriers.
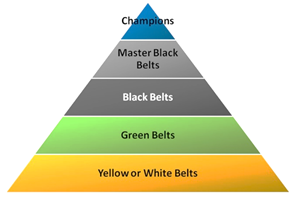
The second level is the Master Black Belt which is the expert with extensive experience and technical expertise whose role is to select an approach. The Black Belt manager is responsible for the operation and outcomes. Next, we have the Green Belt members of the organization who must be trained in the Six Sigma methodology and must participate in the projects as part of their full-time job. Finally, we have the project sponsor who is a senior manager responsible for managing resources, defining objectives, and evaluating outcomes.
There are two major methodologies used within Six Sigma, both composed of five sections. We need to know when to apply DMADV as opposed to DMAIC. The right approach is used to improve product and process design and performance.
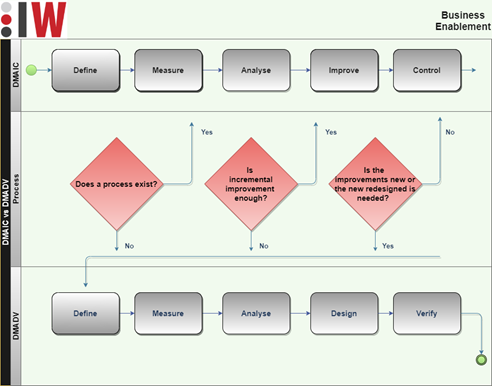
DMADV may sound similar to DMAIC, but there are some significant differences and the collection of additional tools and techniques that are being used. The DMAIC process should be used when an existing product or process requires improvement to meet or exceed the customer’s requirements. The design of new products, services, and processes follow the DMADV process.
The focus of any process improvement is selecting the right project. There are five steps for improvement that should be explained thoroughly to understand the entire picture.
Step 1: Define the problem
The problem that affects the customer or the company should be defined in this phase. This is the phase where the areas of improvement and the goals for the improvement activity are defined, along with ensuring that the resources are in place for the improvement project. The team drafts a Project charter, plans a high-level map of the process, and clarifies the needs of the process.
Step 2: Measure the problem
In this step, a detailed process map created in the define phase can help. The Measure Phase evaluates the process to determine the current process performance, i.e. the baseline. The Measure phase allows you to understand the present condition of the process before you attempt to identify improvements. The inputs to the measure phase are the outputs of the Define phase. The team collects data and focuses on lead time or the quality that the customers receive from the process.
Step 3: Analyze
The Analyze phase is used to identify a few vital causes from a list of potential causes obtained from the Measure phase, actually affecting project outcomes using Six Sigma methodologies. The data collected in the Measure phase are examined to determine a prioritized list of the sources of variation. The root of this phase is to verify hypotheses before implementing solutions. Only then should the team move to the Improve Phase..
Step 4: Improve
The Improve phase of Six Sigma is used to improve the system to do things better, cheaper, or more rapidly by finding the optimum solution for Y, implementing the new approach, and validating using statistical methods. The main objective of the Improve phase is to improve the process by eliminating defects. Structured improvement can lead to innovative changes that will improve the baseline measure and the customer experience.
Step 5: Control
The major activities in the control phase are to validate a measurement system, verify process improvement, and develop a control mechanism. When the improvements and processes are done, the process is fixed, and the team should work to update the best practices and their maintenance.
For successful Six Sigma projects, there are 7 QC management tools that Six Sigma uses. 7 QC is a set of graphical techniques that can improve the process and product quality. The 7 QC Tools consist of the Check sheet, Pareto Chart, Cause and Effect Diagram (Ishikawa Diagram), Histogram, Scatter Diagram, Control Chart, and Stratification.
Check sheets are a very important tool for data collection. The inputs gathered from check sheets can be used to create Pareto diagrams, Fishbone diagrams, etc.
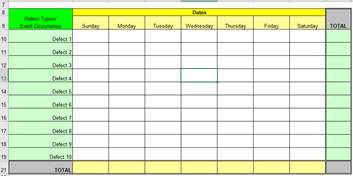
Check sheets are used for collecting and determining the occurrence of events, such as defects and/or nonconformities. They are created after each observation and give a clearer picture of the facts. Check sheets provide a rough graphical representation of where the defects occurred during a process.
The histogram helps in identifying whether the process is capable of meeting requirements. Using the histogram, you can understand which numeric range is the most frequent. The histogram provides valuable information for predicting future performance. It looks like a column chart, but there is one important difference.
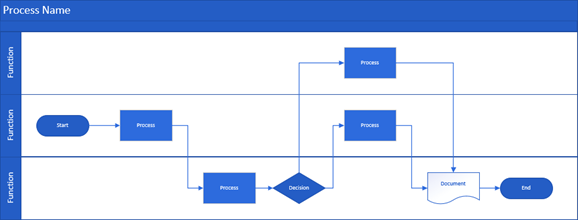
A flow chart/Process map is a graphical representation of processes in an organization presenting the sequence of tasks performed and their relationships. It visually shows the various possible alternatives and helps in selecting an appropriate solution. Additionally, it helps in clarifying process steps and process flow that might not have been understood clearly before. The symbols used in Process Map are the following:

The flow chart/process map allows the team to come to an agreement and examine which activities may impact the process performance. Additionally, it can be used as a training tool, and very often, ‘swim lanes’ can be used on a process map to indicate movement into functional departments.
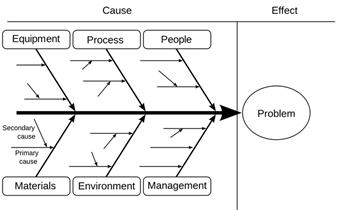
The cause and effect diagram are usually created by a group of people who have knowledge about the process and understand the problems in the company. It is a graphic representation of possible causes for a particular problem under study. This diagram is also known as the Fishbone diagram (because of its fishbone-like structure) or the Ishikawa diagram. It gives the relationship between quality characteristics and their factors. If an Ishikawa diagram does not show an appropriate level of details, it indicates that the team has a general knowledge of the problem. Hence, additional study of the system or involvement is required.
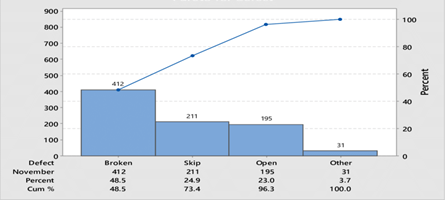
The Pareto Chart is one of the most common charts used by the management inside organizations. Since the availability of money, time, and other resources are restricted, Pareto analysis helps the team to consider only a few vital problematic factors out of trivial ones. The Pareto diagram is based on the Pareto principle, also known as the 80-20 rule, which states that a small number of causes (20%) are responsible for a large percentage (80%) of the effect.
A Scatter Diagram is a graphical representation that shows the possible relationship or association between two variables, factors, or characteristics. It provides both a visual and statistical means to test the strength of a relationship. It is used to show a relationship between independent/cause (x) and dependent/effect (y) variables. Dots clustered together in a line across the diagram showing the strength with which the two factors are related.
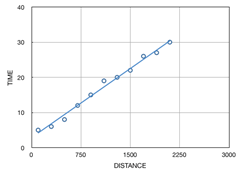
A Scatter diagram is often used in a follow-up to a cause-and-effect diagram to determine if there are more than two variables between cause and effect. By knowing which factors or processes are related and how they are related, it will be easy to control or affect a quality characteristic.
In the control phase of the six-sigma project, a Control Chart is used. It distinguishes specific causes of variation from common causes of variation. Common causes of variation are the natural ones in the process. They are small in magnitude and difficult to identify/remove from the process. Special causes of variation occur due to some special causes. They are large in magnitude and easy to identify/remove from the process. A control chart highlights data points or trends that should be investigated.
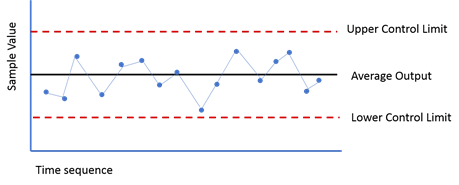
The required information for a control chart is a count or measurement from a process whenever an event occurs or at regular time intervals.
Companies invest a great deal of time, effort, and money in Six Sigma programs. Customer satisfaction depends upon the successful resolution of all Six Sigma’s goals. But customer satisfaction is an objective on its own. Six Sigma is not about the process or the tools, it is about the customer and benefits received from Six Sigma:
- Increased productivity
- Improved quality
- Reduced operation cost
- Higher customer satisfaction
- Improved communication among team members