
Data Transmission using Visual Studio Script to Azure Service Bus: Data is generated or collected by an application or system and then transmitted to Azure Service Bus using a Visual Studio script. This script could be developed using C#, .NET, or any other compatible language. Azure Service Bus acts as a messaging service that decouples the sender and receiver of data, ensuring reliable message delivery and scalability.
Data Processing with Azure Logic Apps: Azure Logic Apps is utilized to read the data from Azure Service Bus, perform necessary transformations or enrichments, and then send the processed data to Log Analytics. Logic Apps provides a visual designer and a wide range of connectors to easily automate workflows without requiring extensive coding. It enables seamless integration and workflow orchestration between different services and applications in the Azure ecosystem.
Data Analysis and Visualization with KQL in Azure Workbook: Once the data is ingested into Log Analytics, it can be queried and analyzed using Kusto Query Language (KQL). Azure Workbooks, a part of Azure Monitor, allows for creating interactive and customizable dashboards to visualize the data stored in Log Analytics. KQL queries can be used to extract relevant insights, perform aggregations, and create visualizations such as charts, graphs, and tables. These visualizations can provide valuable insights into the performance, health, and trends of the data being monitored.
1. Prerequisites
What do we need to create this project?
- Azure Subscription
- Resource Group
- Service Bus Namespace
- Service Bus Queue
- Logic App
- Log Analytics Workspace
- Log Analytics Table
- Log Analytics Workbook
- Send the messages to SB Queue
- Make the flow in Logic App to read, transform and send the messages to Azure Table
- In the workbook visualize the data using KQL
2. What is and how to create Azure Service Bus, Namespace and Queue
Namespace: An Azure Service Bus Namespace is a container for messaging entities such as queues, topics, and subscriptions. It provides a scoping container for all messaging components within a specific environment or application. Namespaces are region-specific and provide high availability and fault tolerance.
Queue: A queue is a fundamental messaging entity within Azure Service Bus that enables asynchronous communication between applications or components. Messages are sent to and received from queues by producers and consumers, respectively. Queues support First-In-First-Out (FIFO) message delivery and decouple message producers from consumers, allowing for reliable and scalable communication between different components of a distributed system.
For creating Service Bus Namespace we open Service Bus service in Azure and simply click on Create button. Then we’ll just have to populate the fields: Subscription, Resource group, Name, Location of the resource and the pricing tier.
After creating the Namespace we should create the queue from the namespace itself and then we should have the following view:
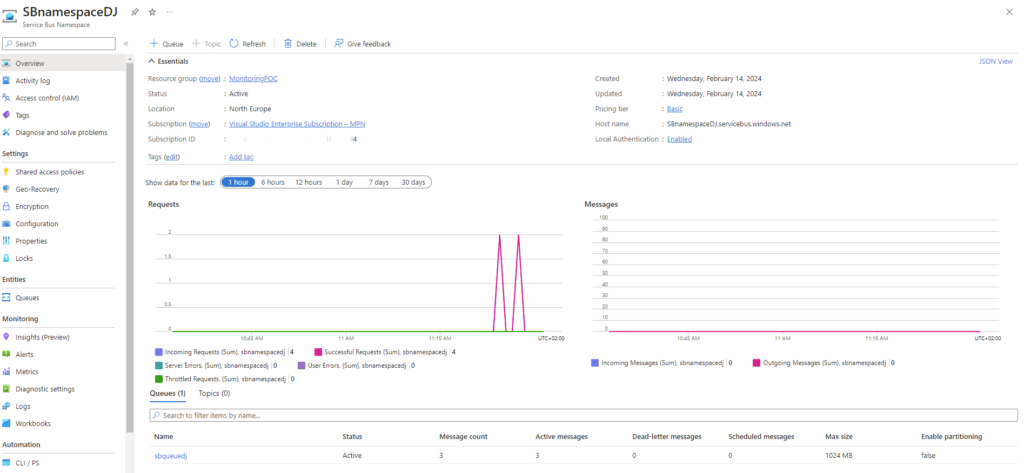
In the Namespace we can see some basic data and the flow of the messages.
At the bottom is our queue and if we click on it, we should see something similar to the following screenshot:
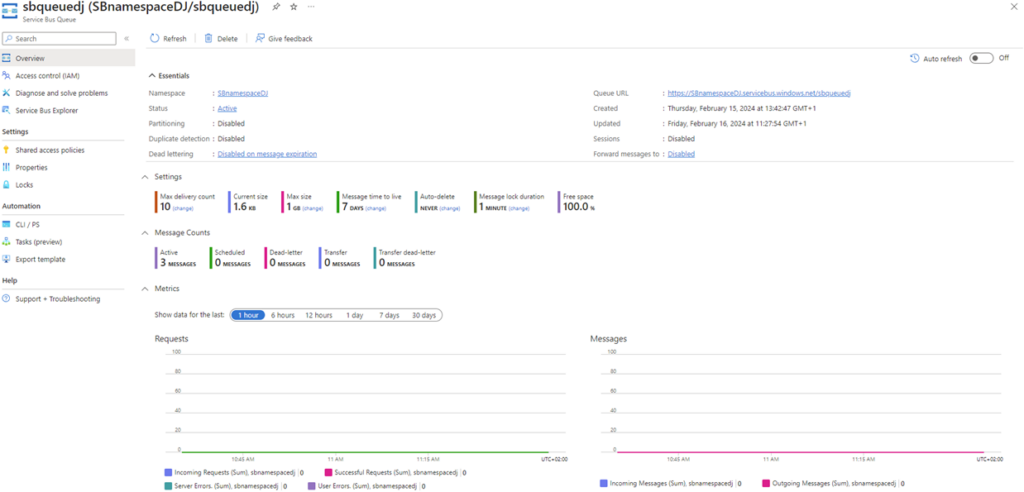
In our case we have 3 pending messages in the queue which will be explained later, how they are sent to the queue.
The messages can be sent as files or a manual message in the form of text, JSON or xml. Manually, if we open Service Bus Explorer from the left palette, we can just click on Send messages option and either attach a file or write a message manually to populate the queue.
For this project, the messages are sent as a JSON file using a code written in C#.
4. Send the data to Azure Service Bus Queue
Before sending data to ASB Queue in our case we did:
· Create Shared Access Policy – In Azure Service Bus, a Shared Access Policy is a security mechanism that defines a set of permissions and access rights for entities such as queues, topics, or subscriptions. It allows you to control who can perform specific actions, such as sending, receiving, or managing messages, on these entities. To create the access policy in our SB Namespace, we open Shared access policies option in the namespace bar and we can add a new one just by populating the Name field and selecting the Claims options which are Manage, Send and Listen, regarding the project needs.
After the policy is created, we automatically have assigned Primary and secondary keys and connections just by clicking on it, and by having them, now sending data to ASB queue is allowed.
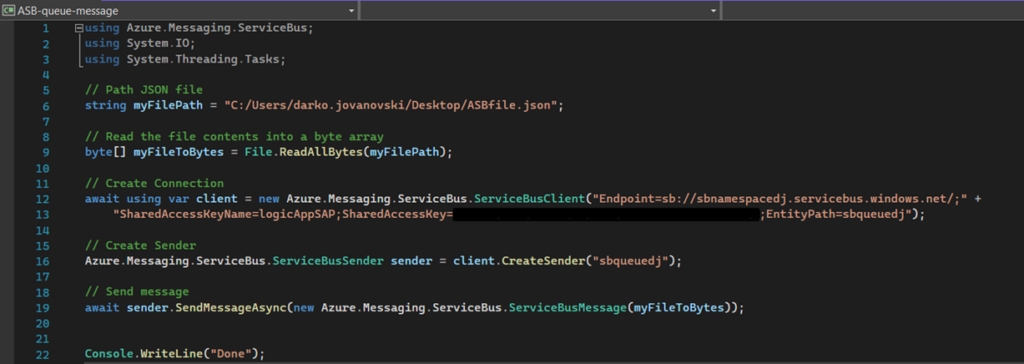
· Create JSON file – This file will be the same one, we want to send through our code to ASB queue, as a new message.
After we have the policy and the file, which is basically a simple JSON file, by using the following C# code, we can deploy the file to ASB queue as the new message:
5. Create Logic App and the flow in the Logic app designer
Azure Logic Apps is a cloud service that allows you to automate and orchestrate workflows by connecting various applications, data sources, and services, without the need for extensive coding. With a visual designer and a wide range of connectors, Logic Apps enable seamless integration and automation of business processes across different platforms and environments. In our case the source is Service Bus queue, and the destination is Log Analytics.
Logic App can be created after we open Logic apps service in Azure and click on Add button.
We will be asked to populate some required fields like Subscription, Resource group, Name, Region, pricing tier and some of Hosting, Networking and Monitoring options.
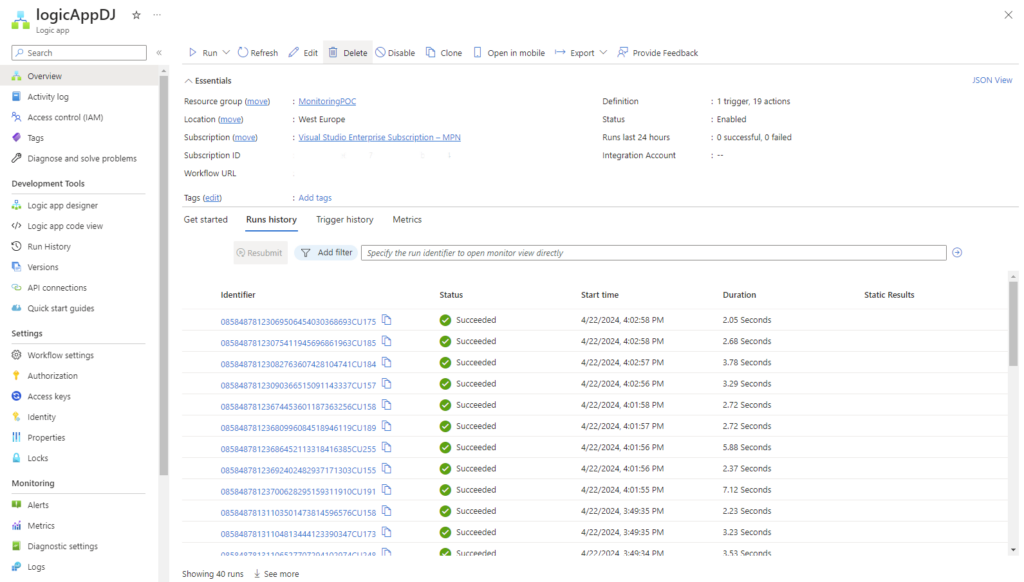
When Logic App is created it will look something like this, without the Historical executions:
6. Logic App Designer
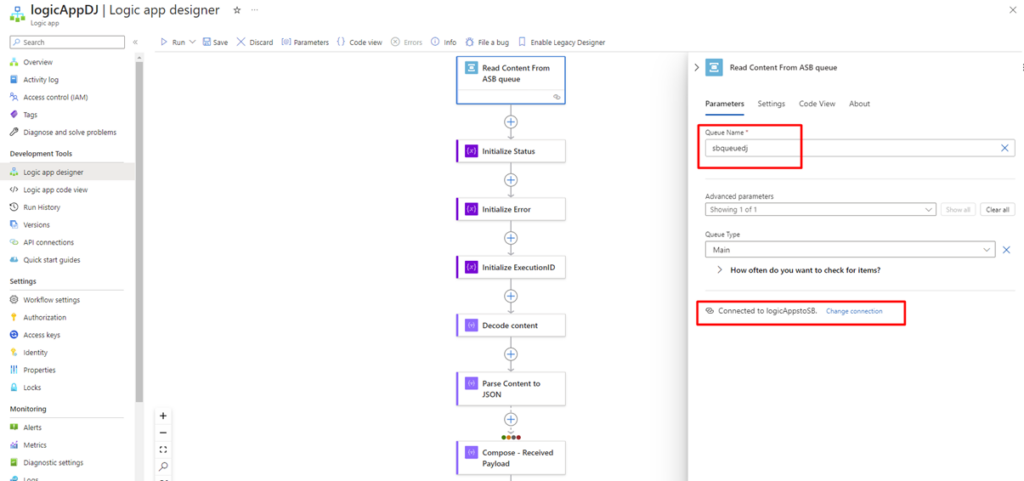
Once we Have the messages in our ASB Queue, we can start to build our Logic App flow. By clicking on Logic App Designer tab in the bar, our empty app window will pop up, and we can start creating Actions and Triggers. For this project, the flow starts with one trigger which reads from the ASB queue, if there are any pending messages, and then continues to manipulate with the data.
Explaining the whole flow:
- The first Trigger is looking if there are any messages pending in the ASB queue, and it can be set up just by populating the Queue name and the connection, which can be created inside
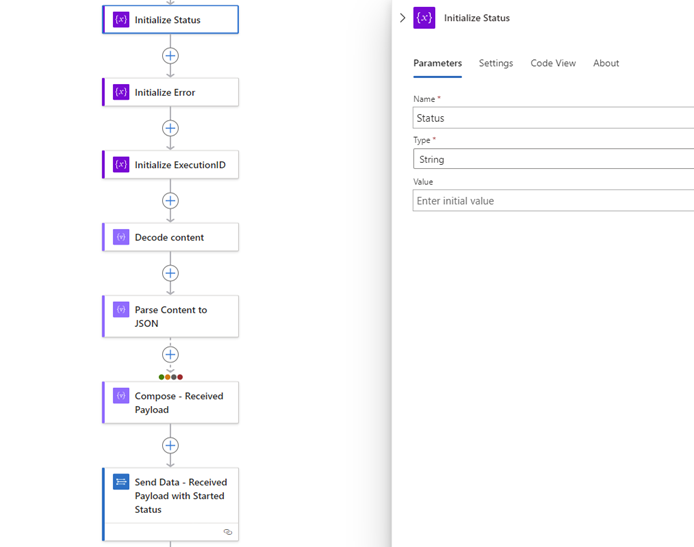
- Next, we have 3 actions which are initialized variables with the name and the type, and later will be granted with a value.
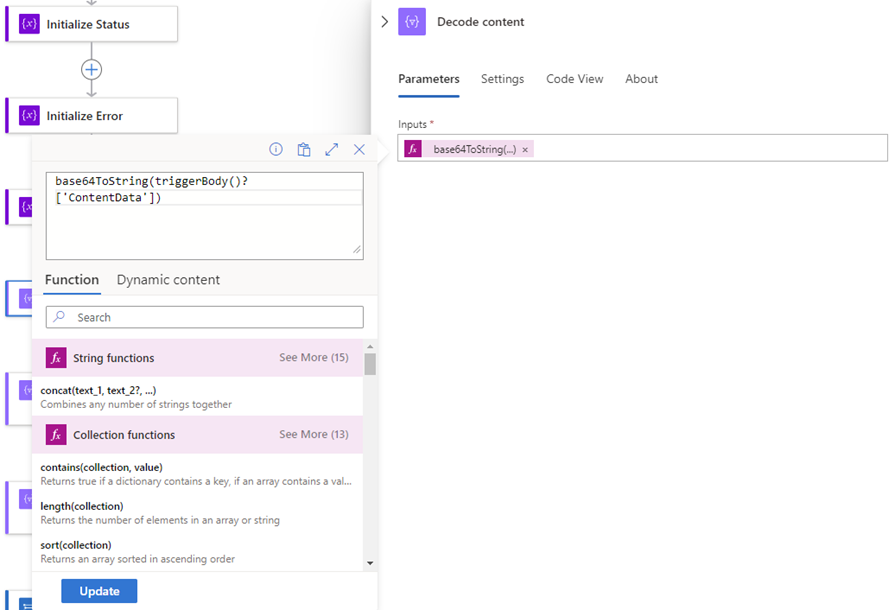
- The next action is Decode content. Since the message in the queue is JSON but the logic app itself reads the message and encodes it, we are decoding it to a text message (String), with an expression.
- Parse JSON Action is the next one which takes as an input, the output of the previous action. Since the output of the previous action is our whole JSON from the queue, but as a String, with this action we are parsing the value, and converting it to a valid message parsed in JSON format.
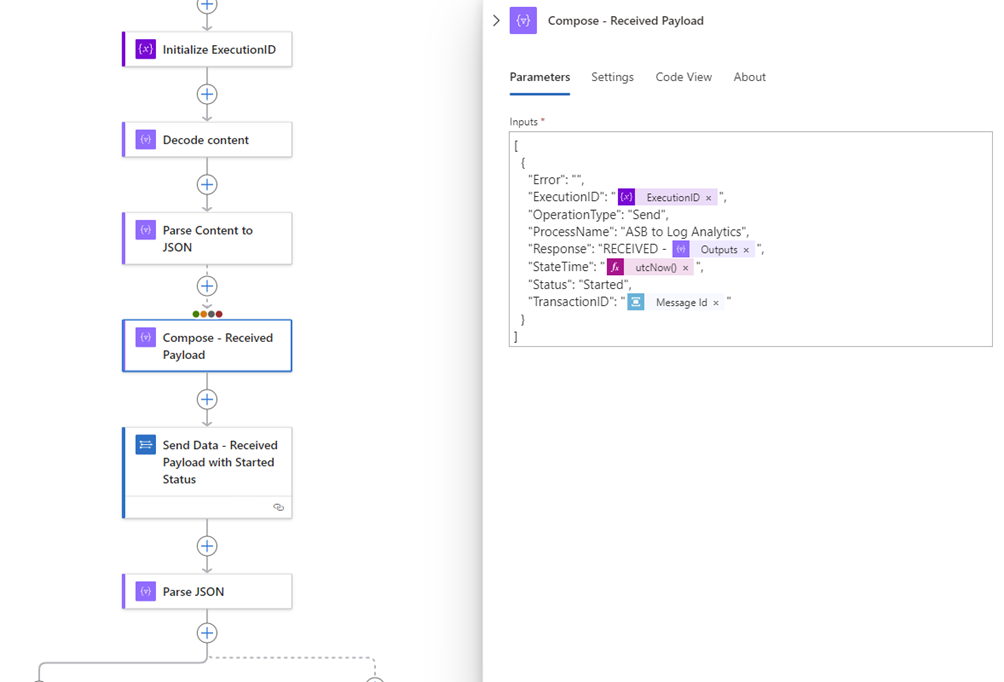
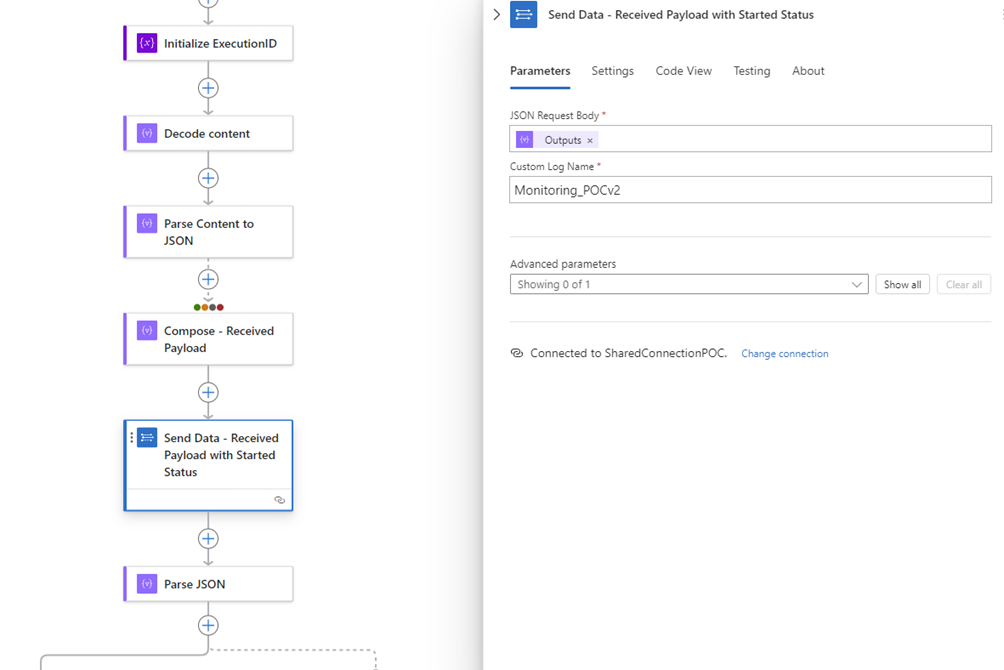
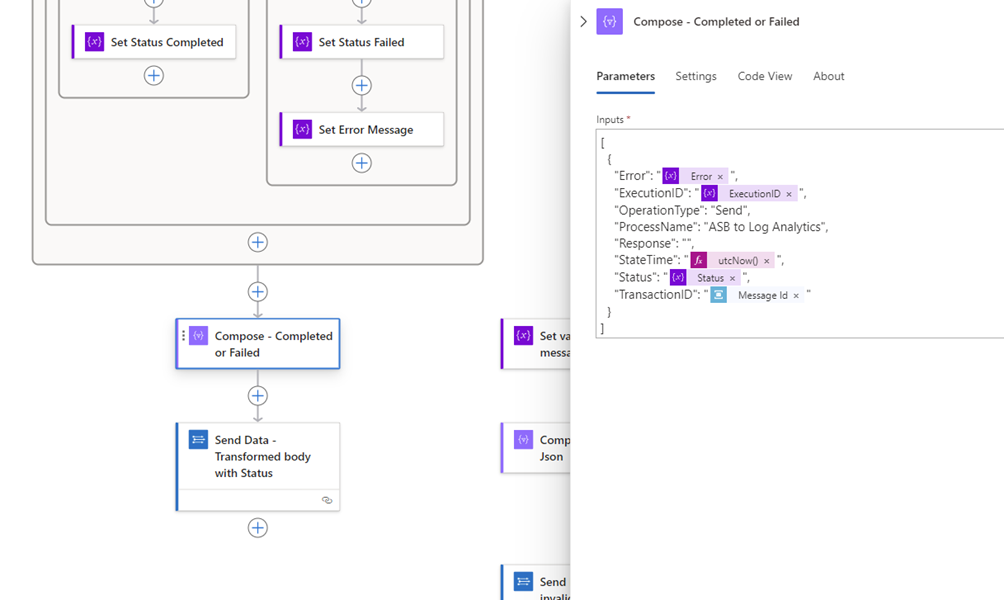
- Next Action is Compose and it takes the already parsed JSON, generates the new one with the correct fields which should be sent to Log Analytics later. The fields are populated per our needs, and in this case we have:
- ExecutionID (the initialized variable from before, with the ID of the Logic App execution itself. It is fetched with an expression “workflow().run.name”).Response: RECEIVED field takes the whole JSON from the previous action, which will be represented as a Received Payload in the visualization later.StateTime represents the time this action is executed, displayed in UTC time.TransactionID field is the ID from the message in our ASB queue.
- Other fields are set as predefined values needed in our visualization.
The colored dots on the top of the action represent the condition this action will run after, based on the execution status the previous action finished. In our case, all the conditions are selected (checkmarks in action settings) which means even if the Parse JSON fails (invalid JSON) or it is skipped for some reason, the compose will run, and send the Received log in Log Analytics.
Note: Default status is Success, all of the other ones, are turned off unless manually changed.
- Next action is Send Data. In this Action We are taking as an input the whole JSON from the Compose action, populating the Custom Log Name field with Azure Log Analytics Table where all the logs will be stored and fill in the connection field (in our case the new one, because of the project purposes). The same connection from previously can also be used.
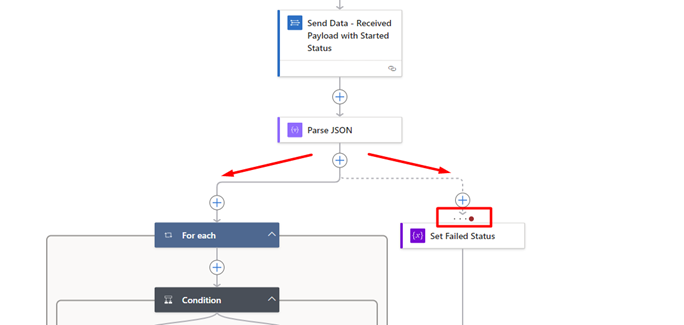
- For now, we have log with status Started sent to Azure Log Analytics Table. The next actions will manipulate and change the data. Starting with the next action which is the same as one of the previous. Parse JSON will take the output of the Decode Content above and try to parse it to JSON again. Since, after the Send Data action, we are not able to manipulate with the executing statuses of the previous actions, we will continue with parsing the content again, but this time after it is parsed, we create parallel branch flow.
The flow will have two branches, left branch will continue only if the Parse JSON succeed, and the right one, like the red dot represents will continue only if the Parse JSON fails, and will send the log in the Table with message “Invalid JSON”.
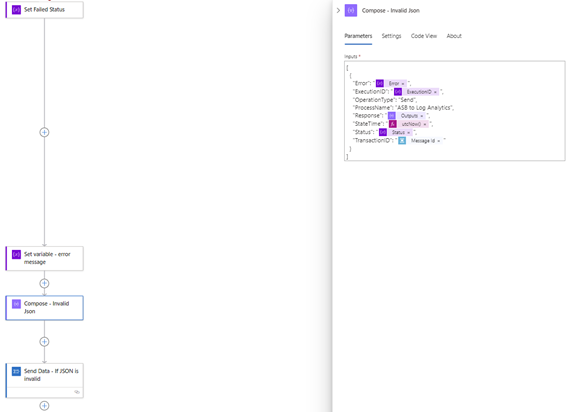
- In this step the failed branch is explained, and after it is triggered, the flow continues only there. This flow represents:
- Set value Failed to the previously initialized variable Status.
- Next action is the same, we are setting the value to the another initialized variable Error, this one is set with the error message “Invalid JSON”.
- The Compose action is similar to the previous one, the difference is just the Error field and the Status field. Instead of hardcoded values, we are using the variables which we set previously.
- The last action of this flow (Send Data) is the same, it sends another log to the Azure Log Analytics Table, but for the same TransactionID.
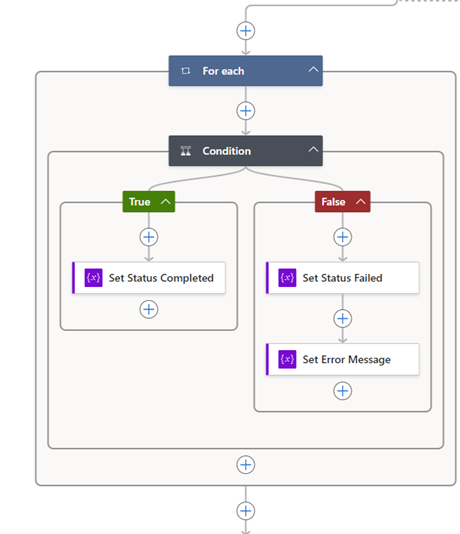
- Continuing with the left branch, if the JSON is successfully parsed, the next step is a condition. This action checks if the fields in the Received JSON, the User field and the Project field meet the conditions, then this action will continue as True. If a single condition is not met, it will continue as False.
- Condition 1 – The User field should end with iwconnect.com domain.
- Condition 2 – The Project fieldshould not be NTT.
After the flow continues, in any flow there is setting the variables that we initialized before. We are setting the values, regarding the status current flow should hold.
- The last step of our logic app is composing the JSON with the latest values we have and sending it to the Azure Table, the same way as before. The composed JSON is known from before.
With this step we are done with the whole Logic App flow, and it is fully explained. The next steps are going to explain how Log Analytics workspace is set, so we have visualized data based on what we send through Logic App.
Note. Logic app can be started manually by clicking “Run” button or by scheduling to run on a certain period of time.
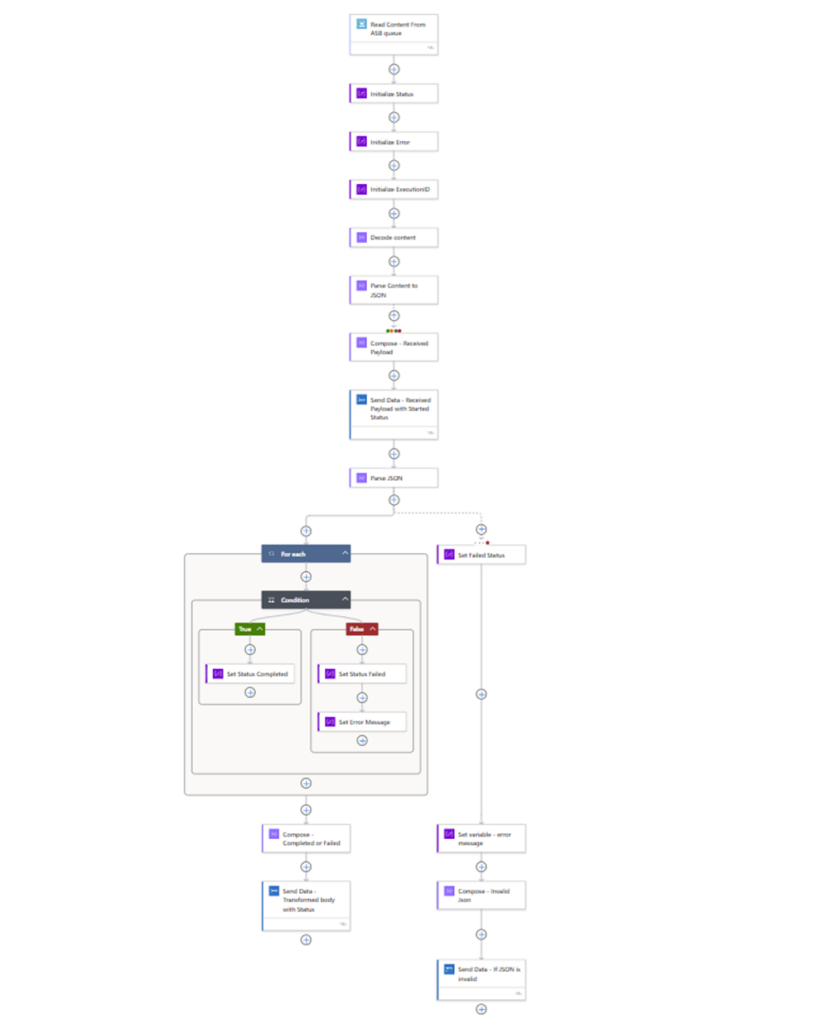
Here is the whole logic app flow in one picture:
7. Azure Log Analytics Workspace
An Azure Log Analytics workspace is a foundational component of Azure Monitor, which provides a centralized location to collect, store, and analyze log and telemetry data from various sources across your Azure environment. Here’s an overview of Log Analytics and its key features:
- Centralized Data Repository: A Log Analytics workspace acts as a centralized repository for log data collected from diverse sources such as virtual machines, applications, containers, and other Azure services. It offers scalable storage for both structured and unstructured data.
- Data Ingestion: The workspace ingests data using agents, API integration, or direct ingestion from Azure services. It supports a wide range of log types, including performance metrics, events, traces, and custom logs.
- Query and Analysis: Log Analytics provides a powerful query language called Kusto Query Language (KQL), which enables you to query and analyze your log data in real-time. With KQL, you can perform complex searches, aggregations, and correlations to extract insights from your data.
- Visualization and Dashboards: You can create interactive dashboards and reports using built-in visualization tools. These dashboards help you monitor system performance, track key metrics, and visualize trends and anomalies in your data.
- Alerting and Monitoring: Log Analytics allows you to set up alerts based on predefined conditions or custom queries. These alerts notify you of important events, performance issues, or security threats in your environment, enabling proactive monitoring and remediation.
- Integration with Azure Services: Log Analytics seamlessly integrates with other Azure services such as Azure Monitor, Azure Security Center, and Azure Automation. This integration enables comprehensive monitoring, logging, and management of your Azure resources.
- Advanced Analytics: Advanced analytics capabilities, such as machine learning-based anomaly detection and log anomaly detection, allow you to identify unusual behavior and potential issues in your environment automatically.
To create Log Analytics workspace, it can be done just by opening the service in Azure and clicking on “Create”. Also, by populating the Subscription, Resource group, Name and Region fields, it can be created easily.
8. Azure Log Analytics table
Azure Log Analytics Table is a structured representation of log data stored in Log Analytics workspaces. Tables organize log data into rows and columns, making it easier to query, analyze, and visualize. Key features include:
- Structured Data Storage: Log Analytics Table stores log data in a structured format, with each row representing a log entry and each column representing a specific data field or attribute. This structured storage enables efficient querying and analysis of log data.
- Query Language Support: Log Analytics Table supports querying using the Kusto Query Language (KQL), allowing users to retrieve and manipulate log data based on specific criteria or conditions. Users can perform complex queries, aggregations, and transformations to extract insights from their data.
- Schema and Field Mapping: Log Analytics Table defines a schema for the log data, specifying the fields and data types available in each log entry. Users can map log data to predefined schemas or define custom schemas based on their specific requirements.
- Indexing and Performance: Log Analytics Table optimizes performance by indexing frequently queried fields and optimizing query execution. This ensures fast and efficient retrieval of log data, even from large datasets.
- Integration with Azure Services: Log Analytics Table seamlessly integrates with other Azure services such as Azure Monitor, Azure Security Center, and Azure Automation. This integration enables comprehensive monitoring, logging, and management of Azure resources.
In summary, Azure Log Analytics Table provides a structured and efficient way to store, query, and analyze log data collected in Log Analytics workspaces, enabling users to gain insights and monitor the health and performance of their systems effectively.
Azure Log Analytics table can be created inside of our workspace, by opening “Tables” option from the palette. While creating a table we need to attach a JSON file with the fields the table should contain. In our case, the fields should match with the same composed JSON we are sending it from Logic Apps.
9. Azure Log Analytics workbook
Azure Log Analytics Workbook is a feature within Azure Monitor that enables users to create interactive reports, dashboards, and visualizations based on data collected and stored in Log Analytics workspaces. Workbooks provide a flexible and customizable way to analyze and visualize log data, enabling users to gain insights and monitor the health and performance of their systems. Key features include:
- Interactive Visualizations: Workbooks offer a wide range of visualization types, including charts, graphs, tables, and maps. Users can interact with these visualizations to explore data and drill down into specific details.
- Customizable Templates: Workbooks provide pre-built templates for common scenarios such as performance monitoring, security analysis, and troubleshooting. Users can customize these templates or create their own from scratch to meet specific requirements.
- Data Aggregation and Filtering: Workbooks allow users to aggregate and filter log data using powerful query language capabilities. This enables users to focus on relevant data and extract meaningful insights from large datasets.
- Parameterization: Workbooks support parameterization, allowing users to create dynamic reports that can be customized based on user input or context. This feature enables users to create reusable templates that adapt to different scenarios or environments.
- Sharing and Collaboration: Users can share workbooks with others within their organization, enabling collaboration and knowledge sharing. Workbooks can be exported or published as URLs for easy sharing with stakeholders.
Overall, Azure Log Analytics Workbook provides a flexible and powerful platform for creating custom reports and visualizations based on log data collected in Log Analytics workspaces, helping users to monitor, analyze, and troubleshoot their systems effectively.
Azure Log Analytics Workbook can be created the same way the table is. Inside of our Log Analytics Workspace, just adding a new workbook.
Once we have our workbook, it will be empty, and we can start building our visualizations.
10. Azure Log Analytics workbook example
Once we have created our workbook, we can start building different types of visualization by using Kusto Query Language (KQL). The capabilities are dependent on the data sources and the volume of the data we have.
Workbooks support these kinds of visual components:
- Text parameters
- Using queries:
- Charts
- Grids
- Tiles
- Trees
- Honeycomb
- Graphs
- Maps
- Text visualization
The visualizations can be made much richer depending on the data we have, by making the more complex log queries and using built in options in workbook itself.
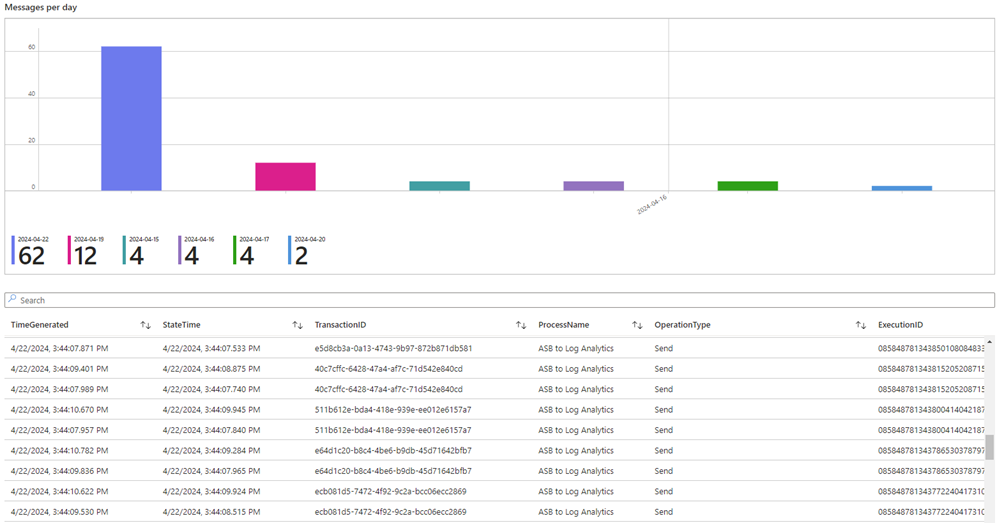
Here is a simple example of a bar chart visualization, and visualizing the data into a table:
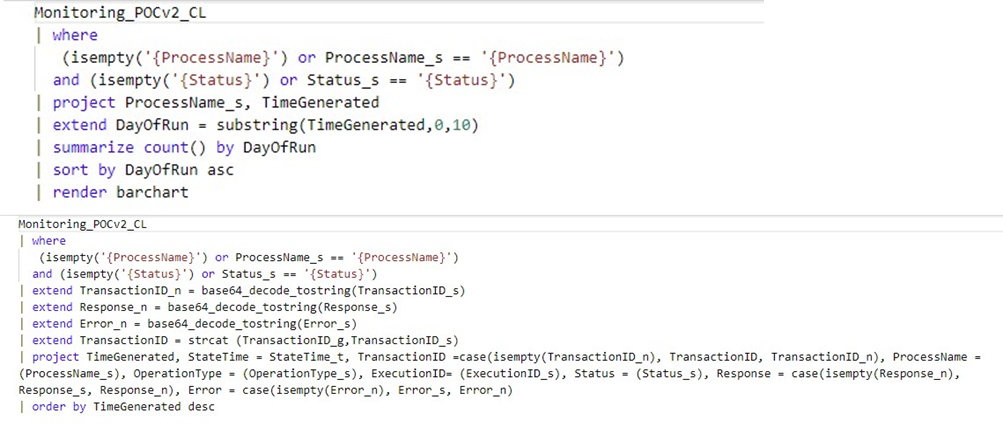
Here are the queries for the provided visualization:
11. Summary
Azure Service Bus is a cloud messaging service that enables reliable communication between applications and services. Logic Apps, on the other hand, are a serverless workflow automation platform provided by Azure. By integrating Azure Service Bus with Logic Apps, you can create workflows that respond to messages received on a Service Bus queue or topic.
Once messages are processed by Logic Apps, you can push relevant data to Azure Log Analytics. Log Analytics is a service in Azure Monitor that collects and analyzes azure monitor logs and telemetry data from Azure resources and on-premises resources. This allows you to gain insights and monitor the health of your applications and infrastructure.
To visualize the data collected in Log Analytics, you can use tools like Azure Monitor or Power BI. These tools provide customizable dashboards and reports that allow you to visualize and analyze the data collected from various sources, including Azure Service Bus and Logic Apps. This enables you to gain valuable insights into your application’s performance, troubleshoot issues, and make informed decisions based on the data collected.